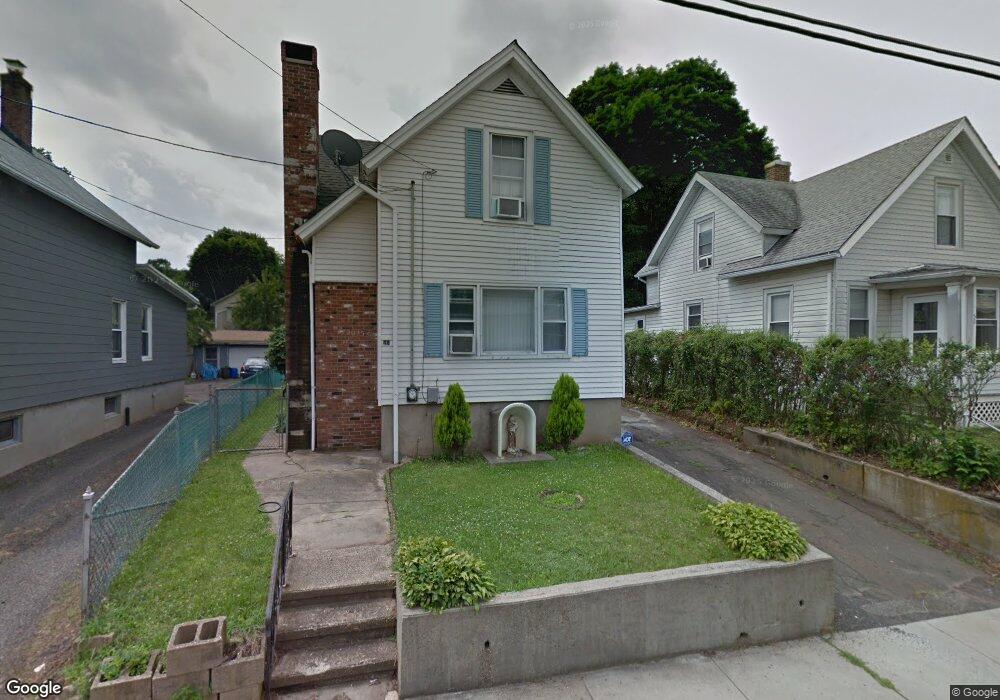
48 Bartlett St Meriden, CT 06451
Estimated Value: $247,805 - $275,000
4
Beds
2
Baths
1,311
Sq Ft
$202/Sq Ft
Est. Value
About This Home
This home is located at 48 Bartlett St, Meriden, CT 06451 and is currently estimated at $265,201, approximately $202 per square foot. 48 Bartlett St is a home located in New Haven County with nearby schools including John Barry School, Lincoln Middle School, and Orville H. Platt High School.
Ownership History
Date
Name
Owned For
Owner Type
Purchase Details
Closed on
Feb 6, 2017
Sold by
Zavaglia Angelina Est
Bought by
Callipari Marlo
Current Estimated Value
Purchase Details
Closed on
Nov 19, 1964
Bought by
Zavaglia Angelina
Create a Home Valuation Report for This Property
The Home Valuation Report is an in-depth analysis detailing your home's value as well as a comparison with similar homes in the area
Home Values in the Area
Average Home Value in this Area
Purchase History
| Date | Buyer | Sale Price | Title Company |
|---|---|---|---|
| Callipari Marlo | $50,000 | -- | |
| Zavaglia Angelina | -- | -- |
Source: Public Records
Mortgage History
| Date | Status | Borrower | Loan Amount |
|---|---|---|---|
| Previous Owner | Zavaglia Angelina | $63,945 | |
| Previous Owner | Zavaglia Angelina | $43,430 | |
| Previous Owner | Zavaglia Angelina | $9,610 | |
| Previous Owner | Zavaglia Angelina | $5,000 |
Source: Public Records
Tax History Compared to Growth
Tax History
| Year | Tax Paid | Tax Assessment Tax Assessment Total Assessment is a certain percentage of the fair market value that is determined by local assessors to be the total taxable value of land and additions on the property. | Land | Improvement |
|---|---|---|---|---|
| 2025 | $3,596 | $94,850 | $21,700 | $73,150 |
| 2024 | $3,653 | $94,850 | $21,700 | $73,150 |
| 2023 | $3,521 | $94,850 | $21,700 | $73,150 |
| 2022 | $3,322 | $94,850 | $21,700 | $73,150 |
| 2021 | $2,651 | $60,900 | $18,270 | $42,630 |
| 2020 | $2,644 | $60,900 | $18,270 | $42,630 |
| 2019 | $2,621 | $60,900 | $18,270 | $42,630 |
| 2018 | $2,631 | $60,900 | $18,270 | $42,630 |
| 2017 | $2,561 | $60,900 | $18,270 | $42,630 |
| 2016 | $2,987 | $75,250 | $20,510 | $54,740 |
| 2015 | $2,912 | $75,110 | $20,370 | $54,740 |
| 2014 | $2,841 | $75,110 | $20,370 | $54,740 |
Source: Public Records
Map
Nearby Homes