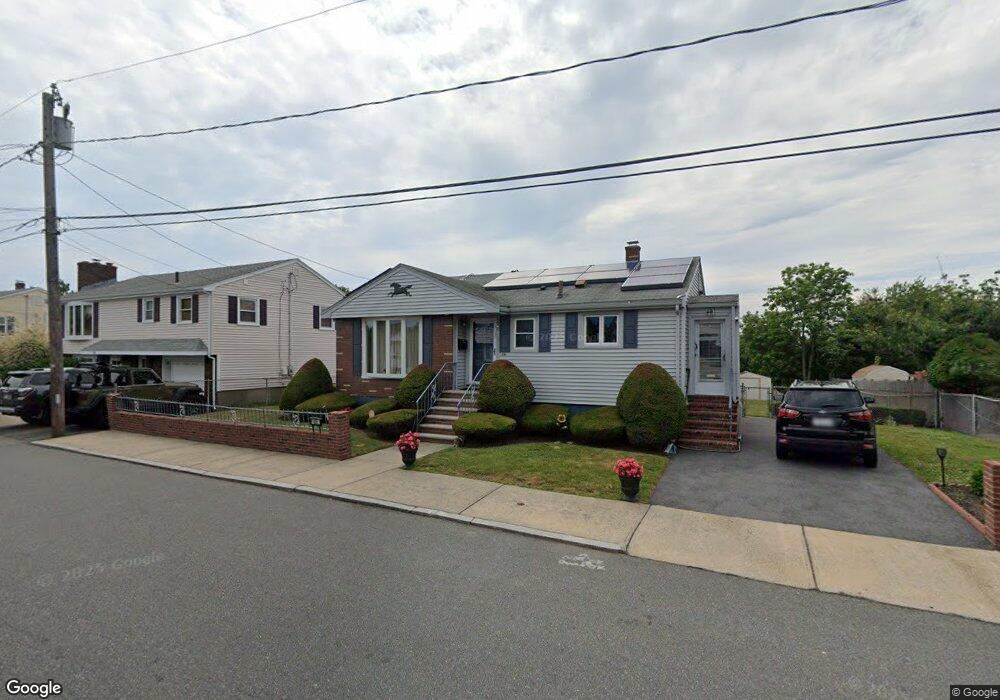
48 Belleview Ave Salem, MA 01970
Witchcraft Heights NeighborhoodEstimated Value: $607,000 - $658,000
3
Beds
2
Baths
966
Sq Ft
$647/Sq Ft
Est. Value
About This Home
This home is located at 48 Belleview Ave, Salem, MA 01970 and is currently estimated at $624,740, approximately $646 per square foot. 48 Belleview Ave is a home located in Essex County with nearby schools including Witchcraft Heights Elementary School, Horace Mann Laboratory, and Bates Elementary School.
Ownership History
Date
Name
Owned For
Owner Type
Purchase Details
Closed on
Sep 16, 2021
Sold by
Murphy Claire C
Bought by
Anders Joanne L
Current Estimated Value
Purchase Details
Closed on
Aug 21, 1986
Bought by
Murphy Claire C
Create a Home Valuation Report for This Property
The Home Valuation Report is an in-depth analysis detailing your home's value as well as a comparison with similar homes in the area
Home Values in the Area
Average Home Value in this Area
Purchase History
| Date | Buyer | Sale Price | Title Company |
|---|---|---|---|
| Anders Joanne L | -- | None Available | |
| Anders Joanne L | -- | None Available | |
| Murphy Claire C | $30,000 | -- |
Source: Public Records
Mortgage History
| Date | Status | Borrower | Loan Amount |
|---|---|---|---|
| Previous Owner | Murphy Claire C | $21,600 | |
| Previous Owner | Murphy Claire C | $25,000 |
Source: Public Records
Tax History Compared to Growth
Tax History
| Year | Tax Paid | Tax Assessment Tax Assessment Total Assessment is a certain percentage of the fair market value that is determined by local assessors to be the total taxable value of land and additions on the property. | Land | Improvement |
|---|---|---|---|---|
| 2025 | $5,939 | $523,700 | $227,400 | $296,300 |
| 2024 | $5,953 | $512,300 | $216,100 | $296,200 |
| 2023 | $5,697 | $455,400 | $199,500 | $255,900 |
| 2022 | $5,426 | $409,500 | $192,800 | $216,700 |
| 2021 | $5,267 | $381,700 | $179,500 | $202,200 |
| 2020 | $5,115 | $354,000 | $169,600 | $184,400 |
| 2019 | $5,033 | $333,300 | $160,900 | $172,400 |
| 2018 | $4,911 | $319,300 | $152,900 | $166,400 |
| 2017 | $4,628 | $291,800 | $129,000 | $162,800 |
| 2016 | $4,478 | $285,800 | $123,000 | $162,800 |
| 2015 | $4,313 | $262,800 | $113,000 | $149,800 |
Source: Public Records
Map
Nearby Homes
- 176 Marlborough Rd
- 159 Marlborough Rd
- 46 Sutton St
- 25 Outlook Ave
- 13 State St
- 9 Sutton St
- 57 Ord St
- 2 Osborne St
- 36 Valley St
- 38 Valley St
- 36 Summit St
- 15 Wall St
- 11 Osborne Hill Dr
- 55 Butler St
- 145 Boston St
- 119 Highland Ave
- 2 Hillside Ave
- 128 Boston St Unit 4
- 111 Foster St Unit 401
- 111 Foster St Unit 416
- 50 Belleview Ave
- 46 Belleview Ave
- 46 Calumet St
- 44 Belleview Ave
- 44 Belleview Ave Unit Belleview Lower Unit
- 52 Belleview Ave
- 45 Belleview Ave
- 47 Belleview Ave
- 44 Calumet St
- 42 Belleview Ave
- 54 Belleview Ave
- 49 Belleview Ave
- 2 Brentwood Ave
- 41 Belleview Ave
- 47 Calumet St
- 10 Rockdale Ave
- 40 Belleview Ave
- 2 Alba Ave
- 1 Alba Ave
- 51 Belleview Ave