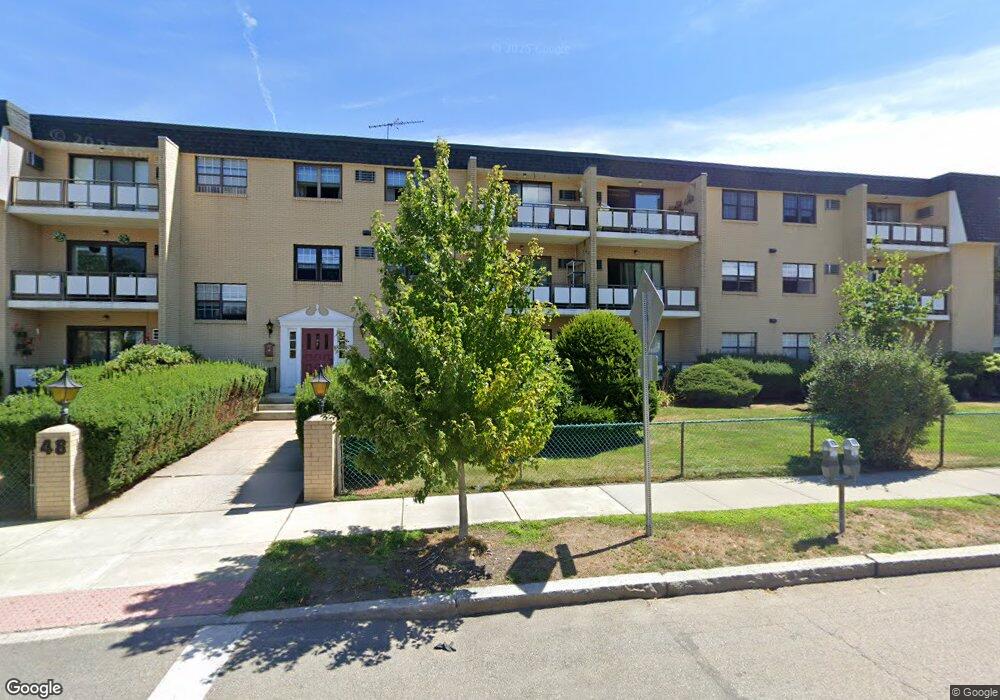
48 Bigelow Ave Unit 37 Watertown, MA 02472
East Watertown NeighborhoodEstimated Value: $670,695 - $703,000
2
Beds
2
Baths
1,100
Sq Ft
$626/Sq Ft
Est. Value
About This Home
This home is located at 48 Bigelow Ave Unit 37, Watertown, MA 02472 and is currently estimated at $688,174, approximately $625 per square foot. 48 Bigelow Ave Unit 37 is a home located in Middlesex County with nearby schools including St. Stephen's Armenian Elementary School, Atrium School, and The Kendall School.
Ownership History
Date
Name
Owned For
Owner Type
Purchase Details
Closed on
Jul 28, 2017
Sold by
Metaxes Penelope Est
Bought by
Stephens Maureen T
Current Estimated Value
Purchase Details
Closed on
Apr 14, 2014
Sold by
Marcelle P Altieri Ret
Bought by
Metaxas Penelope
Purchase Details
Closed on
Jul 29, 2013
Sold by
Altieri Marcelle
Bought by
Marcelle P Altieri Ret and Altieri Marcelle
Purchase Details
Closed on
Apr 20, 2004
Sold by
Terzis Alice F
Bought by
Altieri Marcelle
Home Financials for this Owner
Home Financials are based on the most recent Mortgage that was taken out on this home.
Original Mortgage
$100,000
Interest Rate
5.58%
Mortgage Type
Purchase Money Mortgage
Purchase Details
Closed on
Sep 12, 1991
Sold by
Najarian Carolann S
Bought by
Terzis Alice F
Home Financials for this Owner
Home Financials are based on the most recent Mortgage that was taken out on this home.
Original Mortgage
$127,000
Interest Rate
9.34%
Mortgage Type
Purchase Money Mortgage
Create a Home Valuation Report for This Property
The Home Valuation Report is an in-depth analysis detailing your home's value as well as a comparison with similar homes in the area
Home Values in the Area
Average Home Value in this Area
Purchase History
| Date | Buyer | Sale Price | Title Company |
|---|---|---|---|
| Stephens Maureen T | $498,000 | -- | |
| Metaxas Penelope | $370,000 | -- | |
| Marcelle P Altieri Ret | -- | -- | |
| Altieri Marcelle | $379,000 | -- | |
| Terzis Alice F | $175,000 | -- |
Source: Public Records
Mortgage History
| Date | Status | Borrower | Loan Amount |
|---|---|---|---|
| Previous Owner | Altieri Marcelle | $100,000 | |
| Previous Owner | Terzis Alice F | $127,000 |
Source: Public Records
Tax History Compared to Growth
Tax History
| Year | Tax Paid | Tax Assessment Tax Assessment Total Assessment is a certain percentage of the fair market value that is determined by local assessors to be the total taxable value of land and additions on the property. | Land | Improvement |
|---|---|---|---|---|
| 2025 | $6,628 | $567,500 | $0 | $567,500 |
| 2024 | $6,451 | $551,400 | $0 | $551,400 |
| 2023 | $7,367 | $542,500 | $0 | $542,500 |
| 2022 | $7,269 | $548,600 | $0 | $548,600 |
| 2021 | $6,528 | $532,900 | $0 | $532,900 |
| 2020 | $6,422 | $529,000 | $0 | $529,000 |
| 2019 | $5,790 | $449,500 | $0 | $449,500 |
| 2018 | $5,162 | $383,200 | $0 | $383,200 |
| 2017 | $4,967 | $357,600 | $0 | $357,600 |
| 2016 | $4,631 | $338,500 | $0 | $338,500 |
| 2015 | $4,847 | $322,500 | $0 | $322,500 |
| 2014 | $4,681 | $312,900 | $0 | $312,900 |
Source: Public Records
Map
Nearby Homes
- 238 Arlington St Unit 238
- 1 Clayton St
- 43 Irma Ave Unit 43
- 85 Dexter Ave Unit 87
- 85 Dexter Ave
- 57 Quimby St
- 154 Cypress St
- 87 Templeton Pkwy Unit 3
- 56-58 Edgecliff Rd
- 25 Francis St Unit 2
- 25 Francis St Unit 1
- 81 Winsor Ave
- 163 Belmont St
- 16 Ericsson St
- 133 Hillside Rd
- 10 Marlboro St Unit 1
- 131 Coolidge Ave Unit 123
- 151 Coolidge Ave Unit 105
- 30 Unity Ave Unit 30
- 66 Holworthy St
- 48 Bigelow Ave Unit 38
- 48 Bigelow Ave Unit 36
- 48 Bigelow Ave Unit 35
- 48 Bigelow Ave Unit 34
- 48 Bigelow Ave Unit 33
- 48 Bigelow Ave Unit 31
- 48 Bigelow Ave Unit 28
- 48 Bigelow Ave Unit 27
- 48 Bigelow Ave Unit 26
- 48 Bigelow Ave Unit 25
- 48 Bigelow Ave Unit 24
- 48 Bigelow Ave Unit 23
- 48 Bigelow Ave Unit 22
- 48 Bigelow Ave Unit 21
- 48 Bigelow Ave Unit 18
- 48 Bigelow Ave Unit 17
- 48 Bigelow Ave Unit 16
- 48 Bigelow Ave Unit 15
- 48 Bigelow Ave Unit 14
- 48 Bigelow Ave Unit 13