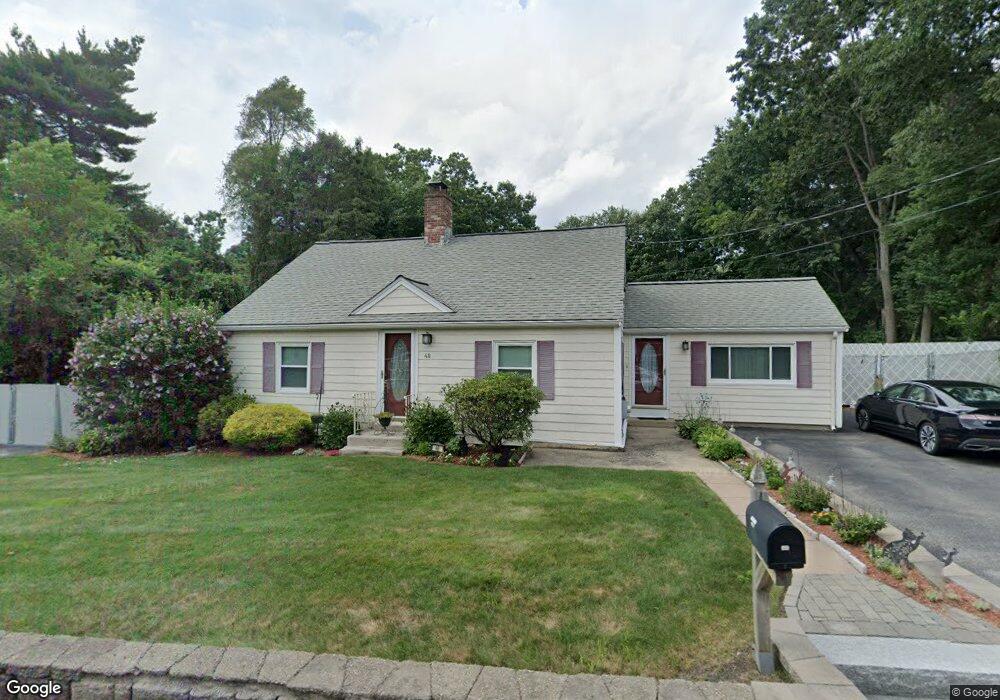
48 Bridge St Tewksbury, MA 01876
Estimated Value: $543,000 - $704,254
3
Beds
2
Baths
1,785
Sq Ft
$369/Sq Ft
Est. Value
About This Home
This home is located at 48 Bridge St, Tewksbury, MA 01876 and is currently estimated at $659,064, approximately $369 per square foot. 48 Bridge St is a home located in Middlesex County with nearby schools including Heath-Brook Elementary School, John W. Wynn Middle School, and John F. Ryan Elementary School.
Ownership History
Date
Name
Owned For
Owner Type
Purchase Details
Closed on
May 15, 2020
Sold by
Fleming Douglas E and Fleming Maria F
Bought by
Fleming Bridge Street T
Current Estimated Value
Purchase Details
Closed on
Aug 26, 1993
Sold by
Silva Rosemarie
Bought by
Mckinnon Craig A and Mac Kinnon Maria
Home Financials for this Owner
Home Financials are based on the most recent Mortgage that was taken out on this home.
Original Mortgage
$99,000
Interest Rate
7.06%
Mortgage Type
Purchase Money Mortgage
Create a Home Valuation Report for This Property
The Home Valuation Report is an in-depth analysis detailing your home's value as well as a comparison with similar homes in the area
Home Values in the Area
Average Home Value in this Area
Purchase History
| Date | Buyer | Sale Price | Title Company |
|---|---|---|---|
| Fleming Bridge Street T | -- | None Available | |
| Mckinnon Craig A | $110,000 | -- |
Source: Public Records
Mortgage History
| Date | Status | Borrower | Loan Amount |
|---|---|---|---|
| Previous Owner | Mckinnon Craig A | $98,300 | |
| Previous Owner | Mckinnon Craig A | $93,750 | |
| Previous Owner | Mckinnon Craig A | $99,000 |
Source: Public Records
Tax History Compared to Growth
Tax History
| Year | Tax Paid | Tax Assessment Tax Assessment Total Assessment is a certain percentage of the fair market value that is determined by local assessors to be the total taxable value of land and additions on the property. | Land | Improvement |
|---|---|---|---|---|
| 2025 | $7,789 | $589,200 | $305,400 | $283,800 |
| 2024 | $7,689 | $574,200 | $291,000 | $283,200 |
| 2023 | $7,212 | $511,500 | $264,400 | $247,100 |
| 2022 | $6,980 | $459,200 | $230,000 | $229,200 |
| 2021 | $6,668 | $424,200 | $209,100 | $215,100 |
| 2020 | $6,390 | $400,100 | $199,100 | $201,000 |
| 2019 | $6,067 | $383,000 | $189,500 | $193,500 |
| 2018 | $5,796 | $359,300 | $189,500 | $169,800 |
| 2017 | $5,459 | $334,700 | $189,500 | $145,200 |
| 2016 | $5,319 | $325,300 | $189,500 | $135,800 |
| 2015 | $4,901 | $299,400 | $183,800 | $115,600 |
| 2014 | $4,711 | $292,400 | $183,800 | $108,600 |
Source: Public Records
Map
Nearby Homes
- 906 Old Shawsheen St
- 7 Wamesit Rd
- 261 Apache Way
- 640 South St
- 127 Caddy Ct
- 93 Fairway Dr
- 610 South St
- 71 Apache Way Unit 71
- 19 Pringle St
- 16 Eagle Dr
- 109 Apache Way
- 22 Carleton Rd
- 20 Oakland Ave
- 54 Delwood Rd
- 40 Nichols St
- 6 Stonebury Way Unit 6
- 177 Salem Rd
- 110 Royal Crest Cir
- 1 Summer St
- 15 Salem St