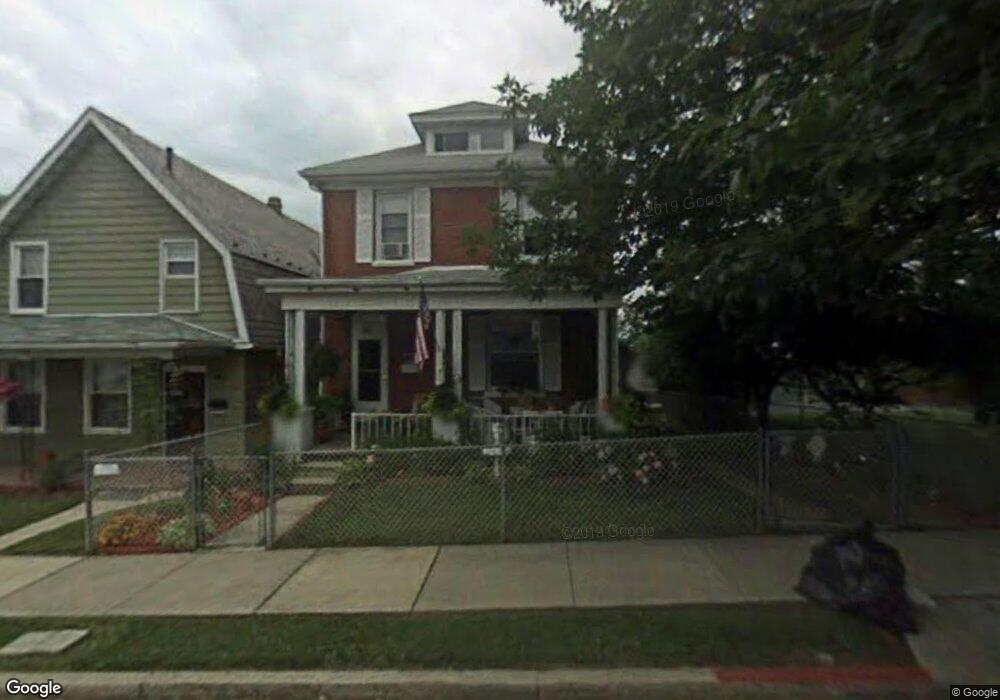
48 Browning St Cumberland, MD 21502
Estimated Value: $98,312 - $111,000
Studio
2
Baths
1,760
Sq Ft
$59/Sq Ft
Est. Value
About This Home
This home is located at 48 Browning St, Cumberland, MD 21502 and is currently estimated at $104,078, approximately $59 per square foot. 48 Browning St is a home located in Allegany County with nearby schools including John Humbird Elementary School, Washington Middle School, and Fort Hill High School.
Ownership History
Date
Name
Owned For
Owner Type
Purchase Details
Closed on
Sep 26, 2018
Sold by
Kelty Joshua C
Bought by
Stewart David K
Current Estimated Value
Home Financials for this Owner
Home Financials are based on the most recent Mortgage that was taken out on this home.
Original Mortgage
$37,000
Outstanding Balance
$32,266
Interest Rate
4.5%
Mortgage Type
New Conventional
Estimated Equity
$71,812
Purchase Details
Closed on
Jul 14, 2004
Sold by
Duckworth Gary A
Bought by
Kelty Joshua C
Purchase Details
Closed on
Jun 3, 2004
Sold by
Ricker Robert H and Ricker Patricia A
Bought by
Duckworth Gary A
Create a Home Valuation Report for This Property
The Home Valuation Report is an in-depth analysis detailing your home's value as well as a comparison with similar homes in the area
Purchase History
| Date | Buyer | Sale Price | Title Company |
|---|---|---|---|
| Stewart David K | $39,000 | Allegheny Highlands Title Z& | |
| Kelty Joshua C | $60,000 | -- | |
| Duckworth Gary A | $35,000 | -- |
Source: Public Records
Mortgage History
| Date | Status | Borrower | Loan Amount |
|---|---|---|---|
| Open | Stewart David K | $37,000 |
Source: Public Records
Tax History
| Year | Tax Paid | Tax Assessment Tax Assessment Total Assessment is a certain percentage of the fair market value that is determined by local assessors to be the total taxable value of land and additions on the property. | Land | Improvement |
|---|---|---|---|---|
| 2025 | $574 | $80,433 | $0 | $0 |
| 2024 | $559 | $73,167 | $0 | $0 |
| 2023 | $529 | $65,900 | $3,600 | $62,300 |
| 2022 | $504 | $60,433 | $0 | $0 |
| 2021 | $485 | $54,967 | $0 | $0 |
| 2020 | $460 | $49,500 | $3,600 | $45,900 |
| 2019 | $462 | $49,500 | $3,600 | $45,900 |
| 2018 | $466 | $49,500 | $3,600 | $45,900 |
| 2017 | $482 | $50,800 | $0 | $0 |
| 2016 | -- | $50,800 | $0 | $0 |
| 2015 | $508 | $50,800 | $0 | $0 |
| 2014 | $508 | $52,600 | $0 | $0 |
Source: Public Records
Map
Nearby Homes
Your Personal Tour Guide
Ask me questions while you tour the home.