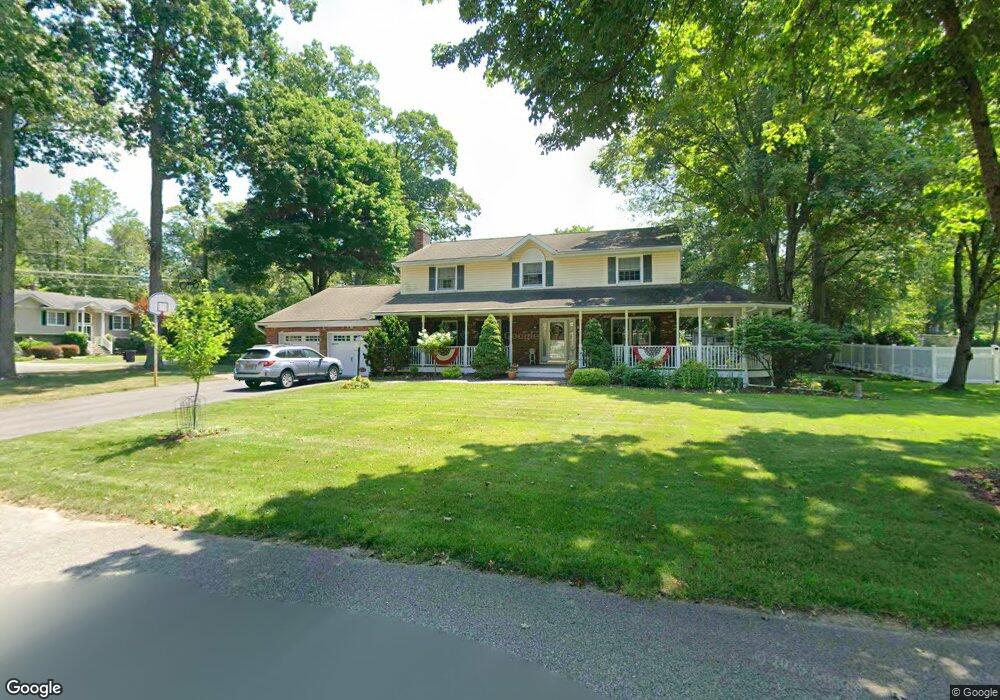
48 Burma Rd Wyckoff, NJ 07481
Estimated Value: $1,244,909 - $1,430,000
--
Bed
--
Bath
2,808
Sq Ft
$485/Sq Ft
Est. Value
About This Home
This home is located at 48 Burma Rd, Wyckoff, NJ 07481 and is currently estimated at $1,363,227, approximately $485 per square foot. 48 Burma Rd is a home located in Bergen County with nearby schools including Abraham Lincoln Elementary School, Dwight D Eisenhower Middle School, and Ramapo High School.
Ownership History
Date
Name
Owned For
Owner Type
Purchase Details
Closed on
Jul 31, 1998
Sold by
Colgan William L and Colgan Kathleen Ann
Bought by
Hafers Charles G and Hafers Nancy A
Current Estimated Value
Home Financials for this Owner
Home Financials are based on the most recent Mortgage that was taken out on this home.
Original Mortgage
$300,000
Outstanding Balance
$62,695
Interest Rate
6.94%
Estimated Equity
$1,300,532
Create a Home Valuation Report for This Property
The Home Valuation Report is an in-depth analysis detailing your home's value as well as a comparison with similar homes in the area
Home Values in the Area
Average Home Value in this Area
Purchase History
| Date | Buyer | Sale Price | Title Company |
|---|---|---|---|
| Hafers Charles G | $420,000 | -- |
Source: Public Records
Mortgage History
| Date | Status | Borrower | Loan Amount |
|---|---|---|---|
| Open | Hafers Charles G | $300,000 |
Source: Public Records
Tax History Compared to Growth
Tax History
| Year | Tax Paid | Tax Assessment Tax Assessment Total Assessment is a certain percentage of the fair market value that is determined by local assessors to be the total taxable value of land and additions on the property. | Land | Improvement |
|---|---|---|---|---|
| 2025 | $17,228 | $883,500 | $523,800 | $359,700 |
| 2024 | $16,725 | $883,500 | $523,800 | $359,700 |
| 2023 | $16,274 | $883,500 | $523,800 | $359,700 |
| 2022 | $16,274 | $883,500 | $523,800 | $359,700 |
| 2021 | $16,380 | $883,500 | $523,800 | $359,700 |
| 2020 | $16,212 | $883,500 | $523,800 | $359,700 |
| 2019 | $15,991 | $883,500 | $523,800 | $359,700 |
| 2018 | $15,744 | $883,500 | $523,800 | $359,700 |
| 2017 | $15,550 | $883,500 | $523,800 | $359,700 |
| 2016 | $15,302 | $883,500 | $523,800 | $359,700 |
| 2015 | $15,134 | $883,500 | $523,800 | $359,700 |
| 2014 | $16,164 | $1,018,500 | $523,800 | $494,700 |
Source: Public Records
Map
Nearby Homes
- 108 Park Ave
- 20 van Schaik Ln
- 53 W Summit Ave
- 4 Elmwood Place
- 29 Westview Terrace
- 137 Elmwood Place
- 190 Madison Ave
- 260 Glen Ave
- 111 Crescent Ave
- 53 Smithfield Rd
- 39 Payne Ave
- 117 Spruce St
- 36 Hemlock St
- 279 Vreeland Ave
- 1-5 Chestnut Place
- 25 Lyon Rd
- 67 Hillside Ave
- 217 Navajo Dr
- 36-4 Tamaron Dr
- 29 Longview Dr