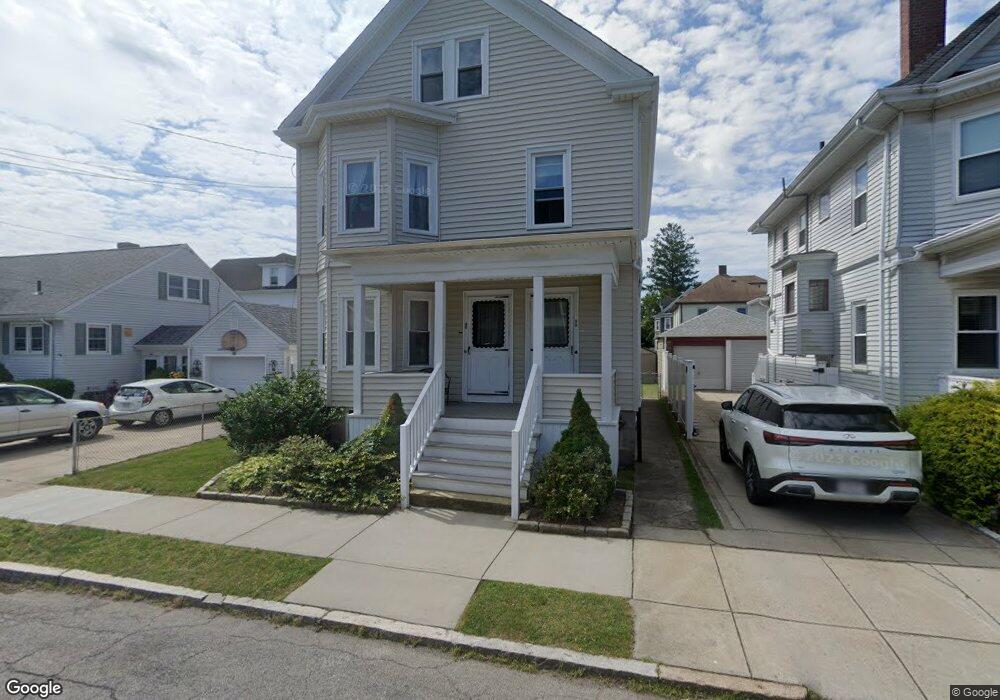
48 Carroll St Unit 50 New Bedford, MA 02740
Downtown New Bedford NeighborhoodEstimated Value: $420,000 - $677,000
6
Beds
2
Baths
2,368
Sq Ft
$225/Sq Ft
Est. Value
About This Home
This home is located at 48 Carroll St Unit 50, New Bedford, MA 02740 and is currently estimated at $532,622, approximately $224 per square foot. 48 Carroll St Unit 50 is a home located in Bristol County with nearby schools including Betsey B. Winslow Elementary School, Keith Middle School, and New Bedford High School.
Ownership History
Date
Name
Owned For
Owner Type
Purchase Details
Closed on
May 18, 2006
Sold by
Howe Katy A
Bought by
Grant Kathryn A
Current Estimated Value
Home Financials for this Owner
Home Financials are based on the most recent Mortgage that was taken out on this home.
Original Mortgage
$185,000
Outstanding Balance
$107,267
Interest Rate
6.42%
Mortgage Type
Purchase Money Mortgage
Estimated Equity
$425,355
Purchase Details
Closed on
Feb 24, 2006
Sold by
Whelan Kathleen C
Bought by
Howe Katy A and Tavares Nelson P
Home Financials for this Owner
Home Financials are based on the most recent Mortgage that was taken out on this home.
Original Mortgage
$275,674
Interest Rate
6.17%
Mortgage Type
Purchase Money Mortgage
Create a Home Valuation Report for This Property
The Home Valuation Report is an in-depth analysis detailing your home's value as well as a comparison with similar homes in the area
Home Values in the Area
Average Home Value in this Area
Purchase History
| Date | Buyer | Sale Price | Title Company |
|---|---|---|---|
| Grant Kathryn A | $291,000 | -- | |
| Grant Kathryn A | $291,000 | -- | |
| Howe Katy A | $280,000 | -- | |
| Howe Katy A | $280,000 | -- |
Source: Public Records
Mortgage History
| Date | Status | Borrower | Loan Amount |
|---|---|---|---|
| Open | Howe Katy A | $185,000 | |
| Closed | Howe Katy A | $185,000 | |
| Previous Owner | Howe Katy A | $275,674 |
Source: Public Records
Tax History Compared to Growth
Tax History
| Year | Tax Paid | Tax Assessment Tax Assessment Total Assessment is a certain percentage of the fair market value that is determined by local assessors to be the total taxable value of land and additions on the property. | Land | Improvement |
|---|---|---|---|---|
| 2025 | $4,875 | $431,000 | $103,200 | $327,800 |
| 2024 | $4,303 | $358,600 | $98,400 | $260,200 |
| 2023 | $4,103 | $287,100 | $88,100 | $199,000 |
| 2022 | $3,748 | $241,200 | $83,900 | $157,300 |
| 2021 | $3,760 | $241,200 | $83,900 | $157,300 |
| 2020 | $3,848 | $238,100 | $87,100 | $151,000 |
| 2019 | $3,793 | $230,300 | $88,700 | $141,600 |
| 2018 | $3,627 | $218,100 | $88,700 | $129,400 |
| 2017 | $3,326 | $199,300 | $88,700 | $110,600 |
| 2016 | $3,128 | $189,700 | $83,900 | $105,800 |
| 2015 | $2,976 | $189,200 | $87,100 | $102,100 |
| 2014 | $2,902 | $191,400 | $88,700 | $102,700 |
Source: Public Records
Map
Nearby Homes
- 48-50 Carroll St
- 52 Carroll St
- 44 Carroll St
- 56 Carroll St
- 13 Ryan St
- 71 Brigham St Unit 73
- 17 Ryan St
- 71-73 Brigham St Unit 3
- 60 Carroll St
- 21 Ryan St Unit 23
- 21-23 Ryan St
- 67-69 Brigham St
- 99 Brigham St
- 47 Carroll St
- 69 Brigham St
- 67 Brigham St Unit 69
- 67 Brigham St Unit A
- 67 Brigham St Unit 3rd
- 51 Carroll St
- 55 Carroll St