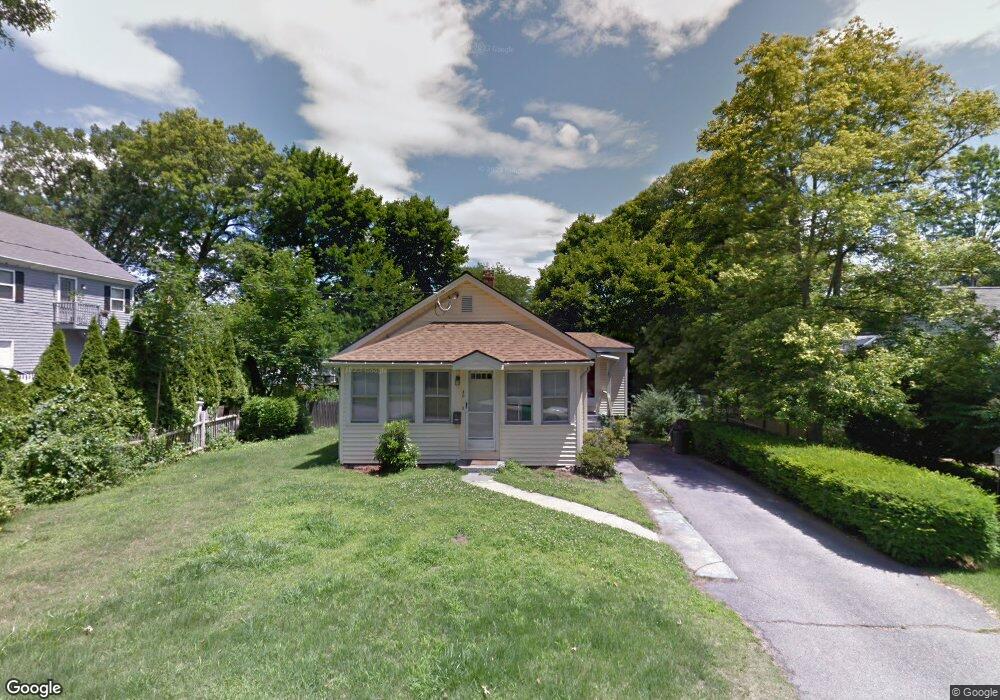
48 Chapman St Walpole, MA 02081
Estimated Value: $362,000 - $499,000
2
Beds
1
Bath
635
Sq Ft
$707/Sq Ft
Est. Value
About This Home
This home is located at 48 Chapman St, Walpole, MA 02081 and is currently estimated at $449,182, approximately $707 per square foot. 48 Chapman St is a home located in Norfolk County with nearby schools including Fisher School, Walpole Middle School, and Walpole High School.
Ownership History
Date
Name
Owned For
Owner Type
Purchase Details
Closed on
Jul 20, 2000
Sold by
Werning Ruth D
Bought by
Williams Kerry A
Current Estimated Value
Home Financials for this Owner
Home Financials are based on the most recent Mortgage that was taken out on this home.
Original Mortgage
$157,500
Interest Rate
8.28%
Mortgage Type
Purchase Money Mortgage
Create a Home Valuation Report for This Property
The Home Valuation Report is an in-depth analysis detailing your home's value as well as a comparison with similar homes in the area
Home Values in the Area
Average Home Value in this Area
Purchase History
| Date | Buyer | Sale Price | Title Company |
|---|---|---|---|
| Williams Kerry A | $175,000 | -- |
Source: Public Records
Mortgage History
| Date | Status | Borrower | Loan Amount |
|---|---|---|---|
| Open | Williams Kerry A | $98,000 | |
| Closed | Williams Kerry A | $25,000 | |
| Closed | Williams Kerry A | $157,500 |
Source: Public Records
Tax History
| Year | Tax Paid | Tax Assessment Tax Assessment Total Assessment is a certain percentage of the fair market value that is determined by local assessors to be the total taxable value of land and additions on the property. | Land | Improvement |
|---|---|---|---|---|
| 2025 | $5,226 | $407,300 | $284,600 | $122,700 |
| 2024 | $5,078 | $384,100 | $273,600 | $110,500 |
| 2023 | $5,007 | $360,500 | $237,900 | $122,600 |
| 2022 | $4,754 | $328,800 | $220,300 | $108,500 |
| 2021 | $4,526 | $305,000 | $207,800 | $97,200 |
| 2020 | $4,651 | $310,300 | $196,100 | $114,200 |
| 2019 | $4,476 | $296,400 | $188,600 | $107,800 |
| 2018 | $4,031 | $264,000 | $181,200 | $82,800 |
| 2017 | $3,917 | $255,500 | $174,200 | $81,300 |
| 2016 | $3,773 | $242,500 | $167,400 | $75,100 |
| 2015 | $3,630 | $231,200 | $159,100 | $72,100 |
| 2014 | $3,541 | $224,700 | $159,100 | $65,600 |
Source: Public Records
Map
Nearby Homes
- 291 Plimpton St
- 7 Tilton Ct Unit Ct
- 241 Fisher St
- 56 North St
- 363 - 367 Washington St
- 2 Kendall St
- 40 Endean Dr
- 8 Mckinley Ave
- 120 Polley Ln
- 38 Garden Pkwy
- 28 Eastover Rd Unit 28
- 32 Rainbow Pond Dr Unit B1
- 881 Main St Unit 9
- 6 Litchfields Way
- 19 and 23 Arlington Ln
- 222 School St Unit 9
- 224 School St Unit 9
- Unit 11 Powder House Ln Unit 11
- 8 Powder House Ln Unit 2
- Unit 12 Powder House Ln Unit 12
Your Personal Tour Guide
Ask me questions while you tour the home.