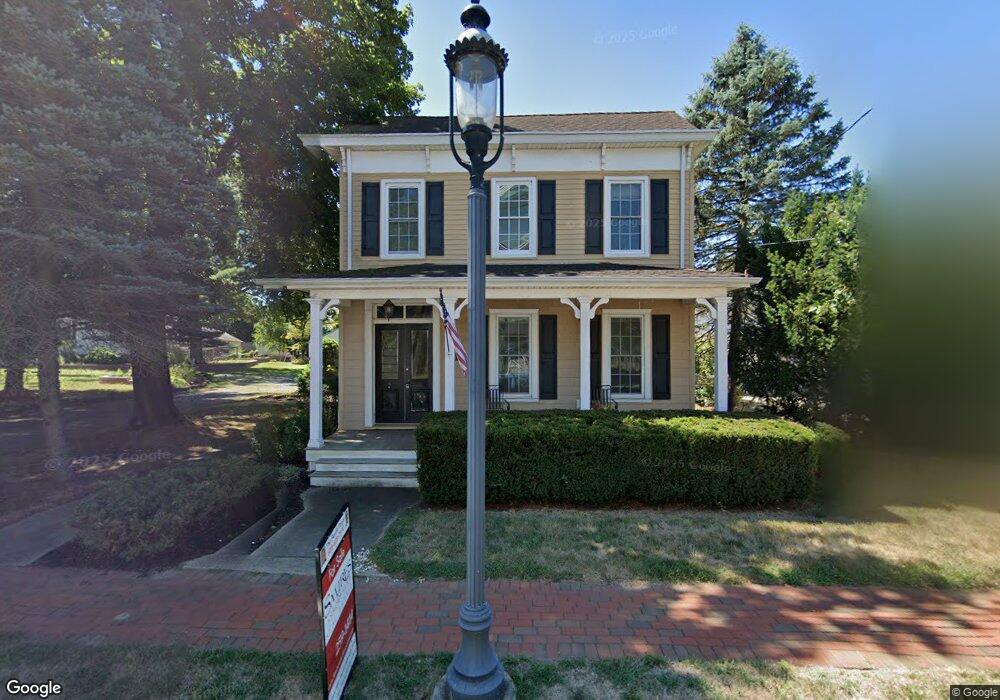
48 Church St Windsor, NJ 08561
Estimated Value: $619,584 - $804,000
5
Beds
3
Baths
3,183
Sq Ft
$229/Sq Ft
Est. Value
About This Home
This home is located at 48 Church St, Windsor, NJ 08561 and is currently estimated at $729,146, approximately $229 per square foot. 48 Church St is a home located in Mercer County with nearby schools including Sharon Elementary School, Pond Road Middle School, and Robbinsville High School.
Ownership History
Date
Name
Owned For
Owner Type
Purchase Details
Closed on
Oct 18, 2022
Sold by
Osborn Susan
Bought by
Goldberg Adam and Osborn George E
Current Estimated Value
Home Financials for this Owner
Home Financials are based on the most recent Mortgage that was taken out on this home.
Original Mortgage
$357,000
Outstanding Balance
$343,491
Interest Rate
6.02%
Mortgage Type
New Conventional
Estimated Equity
$385,655
Purchase Details
Closed on
Jul 10, 2008
Sold by
Gabert Theresa and Gabet Matthew
Bought by
Osborn Susan
Purchase Details
Closed on
Mar 20, 2008
Sold by
Exr Matthew Gabert and Gabert Kurt
Bought by
Gabert Matthew and Gabert Kurt
Purchase Details
Closed on
Sep 5, 1990
Sold by
Gaberet Otto and Gaberet Theresa
Bought by
Gabert Theresa
Create a Home Valuation Report for This Property
The Home Valuation Report is an in-depth analysis detailing your home's value as well as a comparison with similar homes in the area
Home Values in the Area
Average Home Value in this Area
Purchase History
| Date | Buyer | Sale Price | Title Company |
|---|---|---|---|
| Goldberg Adam | $557,000 | Foundation Title | |
| Goldberg Adam | $557,000 | Foundation Title | |
| Osborn Susan | $210,000 | -- | |
| Gabert Matthew | -- | -- | |
| Gabert Theresa | -- | -- |
Source: Public Records
Mortgage History
| Date | Status | Borrower | Loan Amount |
|---|---|---|---|
| Open | Goldberg Adam | $357,000 | |
| Closed | Goldberg Adam | $357,000 |
Source: Public Records
Tax History Compared to Growth
Tax History
| Year | Tax Paid | Tax Assessment Tax Assessment Total Assessment is a certain percentage of the fair market value that is determined by local assessors to be the total taxable value of land and additions on the property. | Land | Improvement |
|---|---|---|---|---|
| 2025 | $13,589 | $406,600 | $180,000 | $226,600 |
| 2024 | $12,682 | $406,600 | $180,000 | $226,600 |
| 2023 | $12,682 | $406,600 | $180,000 | $226,600 |
| 2022 | $12,190 | $406,600 | $180,000 | $226,600 |
| 2021 | $12,015 | $406,600 | $180,000 | $226,600 |
| 2020 | $12,019 | $406,600 | $180,000 | $226,600 |
| 2019 | $12,023 | $406,600 | $180,000 | $226,600 |
| 2018 | $11,946 | $406,600 | $180,000 | $226,600 |
| 2017 | $11,922 | $406,600 | $180,000 | $226,600 |
| 2016 | $11,812 | $406,600 | $180,000 | $226,600 |
| 2015 | $11,633 | $406,600 | $180,000 | $226,600 |
| 2014 | $11,673 | $406,600 | $180,000 | $226,600 |
Source: Public Records
Map
Nearby Homes
- 23 N Main St
- 1305 1325 Route 130
- 45 Bennet Field Way
- 51 Bennet Field Way
- Hampton Plan at Preston Pointe
- 47 Bennet Field Way
- 32 Bennet Field Way
- 43 Bennet Field Way
- 49 Bennet Field Way
- 38 Bennet Field Way
- Chadwick Plan at Preston Pointe
- 55 Bennet Field Way
- 57 Bennet Field Way
- 94 Tindall Rd
- 260 Gordon Rd
- 299 Perrineville Rd
- 309 Gordon Rd
- 332 Gordon Rd
- 179 Robbinsville Edinburg Rd
- 55 Rainflower Ln