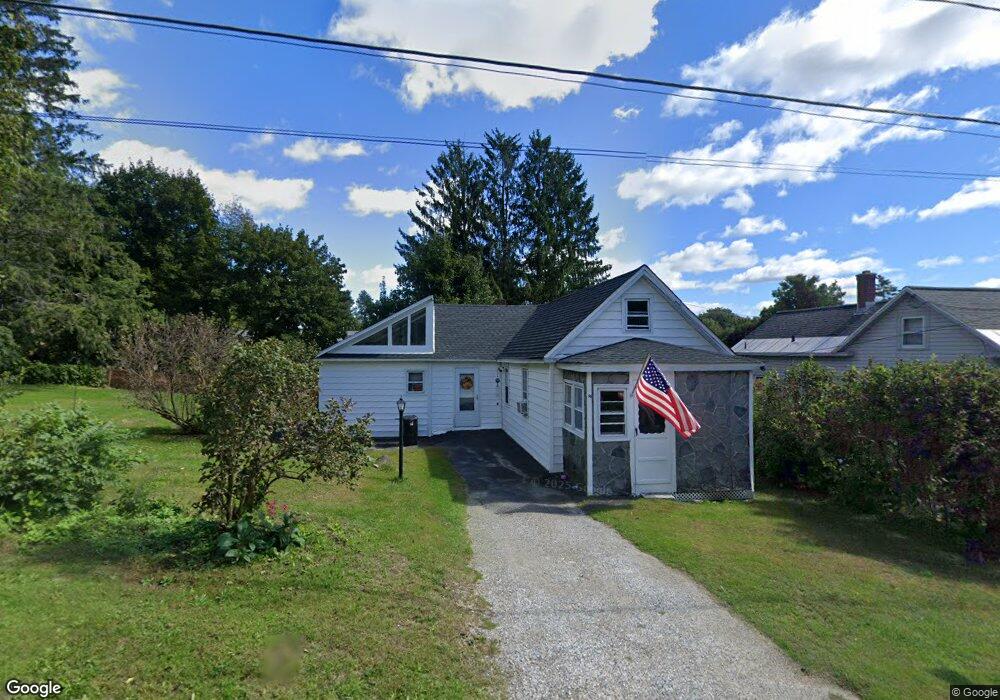
48 Clarendon St Pittsfield, MA 01201
Estimated Value: $193,599 - $215,000
2
Beds
1
Bath
676
Sq Ft
$303/Sq Ft
Est. Value
About This Home
This home is located at 48 Clarendon St, Pittsfield, MA 01201 and is currently estimated at $204,650, approximately $302 per square foot. 48 Clarendon St is a home located in Berkshire County with nearby schools including Silvio O. Conte Community School, John T. Reid Middle School, and Taconic High School.
Ownership History
Date
Name
Owned For
Owner Type
Purchase Details
Closed on
Jun 16, 2004
Sold by
Crennan Lynn T and Crennan Timothy S
Bought by
Demastrie Christopher D and Demastrie Deborah J
Current Estimated Value
Home Financials for this Owner
Home Financials are based on the most recent Mortgage that was taken out on this home.
Original Mortgage
$81,480
Outstanding Balance
$40,151
Interest Rate
6.12%
Mortgage Type
Purchase Money Mortgage
Estimated Equity
$164,499
Purchase Details
Closed on
Sep 1, 1988
Sold by
Herene Timothy W
Bought by
Crennan Timothy S
Create a Home Valuation Report for This Property
The Home Valuation Report is an in-depth analysis detailing your home's value as well as a comparison with similar homes in the area
Home Values in the Area
Average Home Value in this Area
Purchase History
| Date | Buyer | Sale Price | Title Company |
|---|---|---|---|
| Demastrie Christopher D | $84,000 | -- | |
| Demastrie Christopher D | $84,000 | -- | |
| Crennan Timothy S | $75,000 | -- |
Source: Public Records
Mortgage History
| Date | Status | Borrower | Loan Amount |
|---|---|---|---|
| Open | Crennan Timothy S | $81,480 | |
| Closed | Crennan Timothy S | $2,520 | |
| Closed | Crennan Timothy S | $81,480 | |
| Previous Owner | Crennan Timothy S | $78,271 |
Source: Public Records
Tax History Compared to Growth
Tax History
| Year | Tax Paid | Tax Assessment Tax Assessment Total Assessment is a certain percentage of the fair market value that is determined by local assessors to be the total taxable value of land and additions on the property. | Land | Improvement |
|---|---|---|---|---|
| 2025 | $2,939 | $163,800 | $60,000 | $103,800 |
| 2024 | $2,917 | $158,100 | $60,000 | $98,100 |
| 2023 | $2,764 | $150,900 | $60,000 | $90,900 |
| 2022 | $2,533 | $136,500 | $57,500 | $79,000 |
| 2021 | $2,389 | $124,100 | $57,500 | $66,600 |
| 2020 | $1,930 | $97,900 | $48,000 | $49,900 |
| 2019 | $1,866 | $96,100 | $48,000 | $48,100 |
| 2018 | $1,889 | $94,400 | $48,000 | $46,400 |
| 2017 | $1,759 | $89,600 | $45,000 | $44,600 |
| 2016 | $1,679 | $89,500 | $45,000 | $44,500 |
| 2015 | $1,616 | $89,500 | $45,000 | $44,500 |
Source: Public Records
Map
Nearby Homes