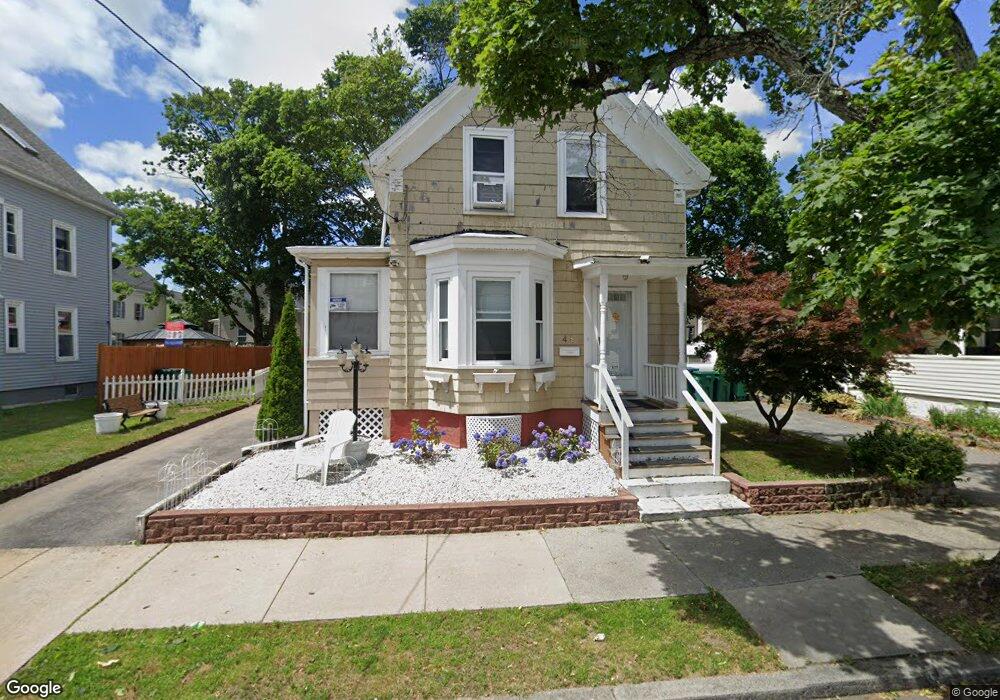
48 Coburn St Lynn, MA 01902
Chatham Street NeighborhoodEstimated Value: $478,000 - $506,920
2
Beds
1
Bath
1,264
Sq Ft
$391/Sq Ft
Est. Value
About This Home
This home is located at 48 Coburn St, Lynn, MA 01902 and is currently estimated at $494,730, approximately $391 per square foot. 48 Coburn St is a home located in Essex County with nearby schools including Ingalls Elementary School, William R. Fallon School, and Marshall Middle School.
Ownership History
Date
Name
Owned For
Owner Type
Purchase Details
Closed on
Jan 4, 2017
Sold by
Duverger Edward J and Duverger Bernice H
Bought by
Duverger Edward J
Current Estimated Value
Purchase Details
Closed on
Jul 15, 1999
Sold by
Orluk Joanne L and Orluk Stanley A
Bought by
Duverger Edward J and Duverger Bernice H
Home Financials for this Owner
Home Financials are based on the most recent Mortgage that was taken out on this home.
Original Mortgage
$132,600
Interest Rate
7.39%
Mortgage Type
Purchase Money Mortgage
Create a Home Valuation Report for This Property
The Home Valuation Report is an in-depth analysis detailing your home's value as well as a comparison with similar homes in the area
Home Values in the Area
Average Home Value in this Area
Purchase History
| Date | Buyer | Sale Price | Title Company |
|---|---|---|---|
| Duverger Edward J | -- | -- | |
| Duverger Edward J | -- | -- | |
| Duverger Edward J | $130,000 | -- | |
| Duverger Edward J | $130,000 | -- |
Source: Public Records
Mortgage History
| Date | Status | Borrower | Loan Amount |
|---|---|---|---|
| Previous Owner | Duverger Edward J | $114,950 | |
| Previous Owner | Duverger Edward J | $130,982 | |
| Previous Owner | Duverger Edward J | $132,600 |
Source: Public Records
Tax History
| Year | Tax Paid | Tax Assessment Tax Assessment Total Assessment is a certain percentage of the fair market value that is determined by local assessors to be the total taxable value of land and additions on the property. | Land | Improvement |
|---|---|---|---|---|
| 2025 | $5,004 | $483,000 | $198,200 | $284,800 |
| 2024 | $4,816 | $457,400 | $188,800 | $268,600 |
| 2023 | $4,664 | $418,300 | $184,000 | $234,300 |
| 2022 | $4,501 | $362,100 | $153,500 | $208,600 |
| 2021 | $4,256 | $326,600 | $132,400 | $194,200 |
| 2020 | $4,066 | $303,400 | $125,100 | $178,300 |
| 2019 | $4,067 | $284,400 | $117,000 | $167,400 |
| 2018 | $3,831 | $252,900 | $114,000 | $138,900 |
| 2017 | $3,594 | $230,400 | $100,600 | $129,800 |
| 2016 | $3,417 | $211,200 | $89,000 | $122,200 |
| 2015 | $3,129 | $186,800 | $80,800 | $106,000 |
Source: Public Records
Map
Nearby Homes
Your Personal Tour Guide
Ask me questions while you tour the home.