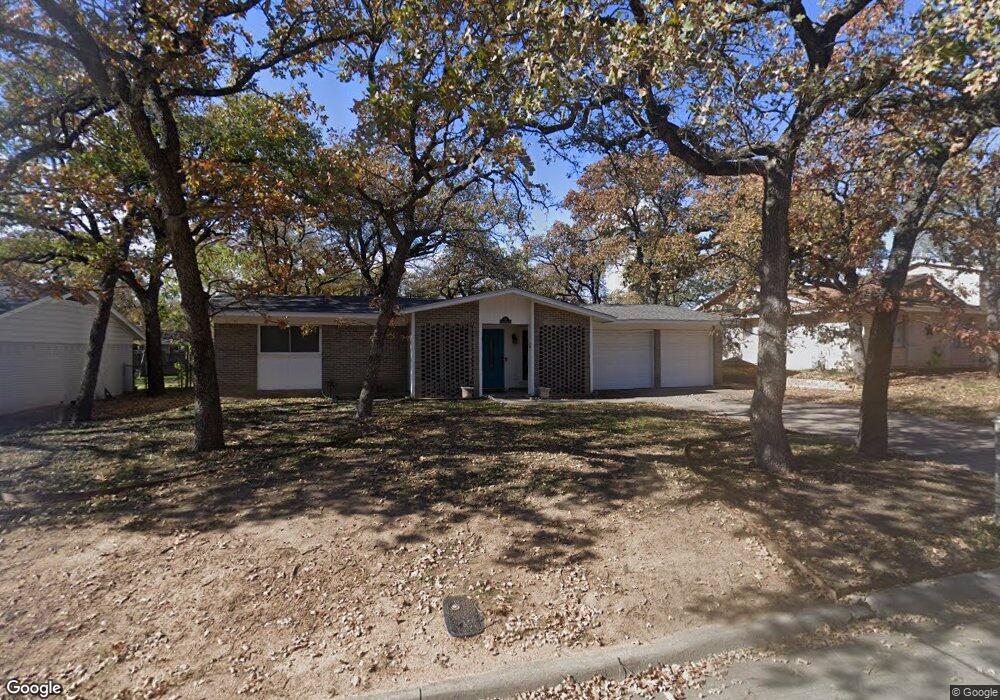
48 Coffee Tavern Rd Bedford, TX 76022
Estimated Value: $242,545 - $291,000
3
Beds
2
Baths
1,026
Sq Ft
$254/Sq Ft
Est. Value
About This Home
This home is located at 48 Coffee Tavern Rd, Bedford, TX 76022 and is currently estimated at $260,636, approximately $254 per square foot. 48 Coffee Tavern Rd is a home located in Tarrant County with nearby schools including Stonegate Elementary School, Central J High School, and L.D. Bell High School.
Ownership History
Date
Name
Owned For
Owner Type
Purchase Details
Closed on
Jul 13, 2020
Sold by
Bounds Jordan
Bought by
Unruh Douglas K and Unruh Tiffany J
Current Estimated Value
Purchase Details
Closed on
Apr 8, 2016
Sold by
Curl Melanie
Bought by
Bounds Jordan
Home Financials for this Owner
Home Financials are based on the most recent Mortgage that was taken out on this home.
Original Mortgage
$122,244
Interest Rate
3.75%
Mortgage Type
FHA
Purchase Details
Closed on
Apr 4, 2011
Sold by
Sullivan Randy and Sullivan Jean
Bought by
Curl Melanie
Home Financials for this Owner
Home Financials are based on the most recent Mortgage that was taken out on this home.
Original Mortgage
$95,515
Interest Rate
4.75%
Mortgage Type
FHA
Purchase Details
Closed on
Apr 30, 2010
Sold by
Kossow Frederick G
Bought by
Sullivan Randy and Sullivan Jean
Create a Home Valuation Report for This Property
The Home Valuation Report is an in-depth analysis detailing your home's value as well as a comparison with similar homes in the area
Home Values in the Area
Average Home Value in this Area
Purchase History
| Date | Buyer | Sale Price | Title Company |
|---|---|---|---|
| Unruh Douglas K | -- | Capital Title | |
| Bounds Jordan | -- | Fidelity National | |
| Curl Melanie | -- | None Available | |
| Sullivan Randy | -- | Title Team Of Texas Llc |
Source: Public Records
Mortgage History
| Date | Status | Borrower | Loan Amount |
|---|---|---|---|
| Previous Owner | Bounds Jordan | $122,244 | |
| Previous Owner | Curl Melanie | $95,515 |
Source: Public Records
Tax History Compared to Growth
Tax History
| Year | Tax Paid | Tax Assessment Tax Assessment Total Assessment is a certain percentage of the fair market value that is determined by local assessors to be the total taxable value of land and additions on the property. | Land | Improvement |
|---|---|---|---|---|
| 2025 | $3,932 | $219,000 | $65,000 | $154,000 |
| 2024 | $3,932 | $219,000 | $65,000 | $154,000 |
| 2023 | $3,932 | $205,000 | $45,000 | $160,000 |
| 2022 | $4,239 | $194,062 | $45,000 | $149,062 |
| 2021 | $4,405 | $187,000 | $45,000 | $142,000 |
| 2020 | $3,485 | $146,564 | $45,000 | $101,564 |
| 2019 | $3,584 | $147,521 | $45,000 | $102,521 |
| 2018 | $3,481 | $143,272 | $22,000 | $121,272 |
| 2017 | $3,275 | $135,393 | $22,000 | $113,393 |
| 2016 | $2,350 | $116,995 | $22,000 | $94,995 |
| 2015 | $1,942 | $88,300 | $18,000 | $70,300 |
| 2014 | $1,942 | $88,300 | $18,000 | $70,300 |
Source: Public Records
Map
Nearby Homes
- 49 Coffee Tavern Rd
- 1236 King Dr
- 1416 Wade Dr
- 604 Donna Ln
- 501 Merrill Dr
- 140 Stonegate Ct
- 93 Regents Park
- 258 Somerset Terrace
- 345 Somerset Cir
- 1112 Ann St
- 1008 Russell Ln
- 1108 Wade Dr
- 1213 Briar Dr
- 344 Bedford Ct E
- 933 Wade Dr
- 341 Hurst Dr
- 1204 Edgecliff Dr
- 2116 Tamworth Ct
- 116 Oakhurst Dr
- 849 Russell Ln
- 56 Coffee Tavern Rd
- 44 Coffee Tavern Rd
- 73 Somerset Terrace
- 69 Somerset Terrace
- 40 Coffee Tavern Rd
- 60 Coffee Tavern Rd
- 77 Somerset Terrace
- 53 Coffee Tavern Rd
- 65 Somerset Terrace
- 57 Coffee Tavern Rd
- 36 Coffee Tavern Rd
- 41 Coffee Tavern Rd
- 61 Somerset Terrace
- 61 Coffee Tavern Rd
- 24 Regents Park
- 68 Somerset Terrace
- 20 Regents Park
- 28 Regents Park
- 76 Somerset Terrace
- 64 Somerset Terrace