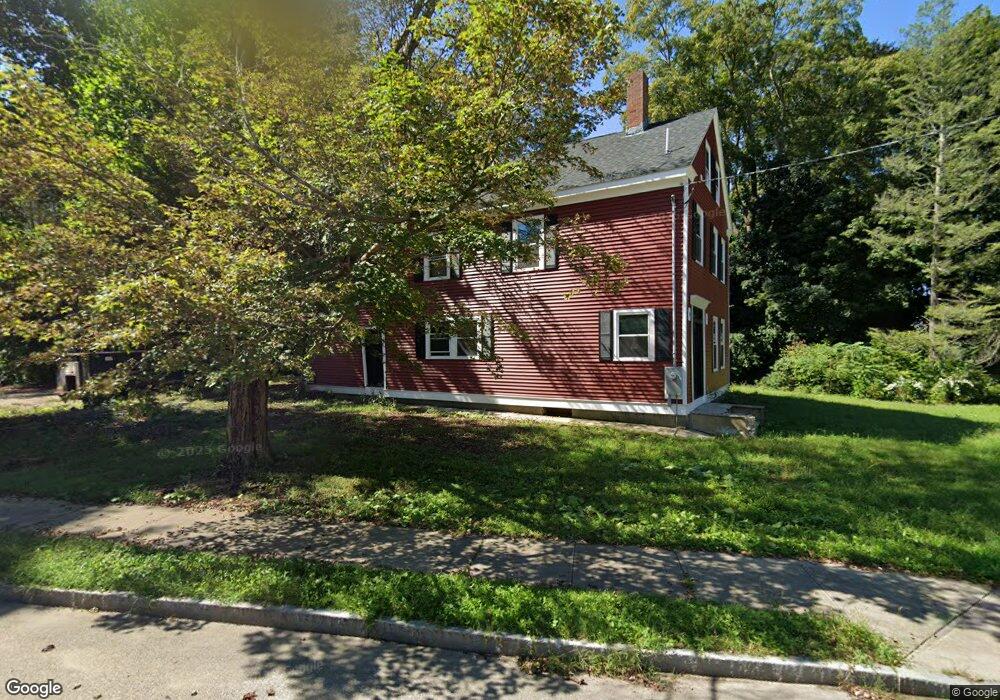
48 Common St Wrentham, MA 02093
Estimated Value: $718,000 - $811,000
4
Beds
3
Baths
2,766
Sq Ft
$281/Sq Ft
Est. Value
About This Home
This home is located at 48 Common St, Wrentham, MA 02093 and is currently estimated at $776,926, approximately $280 per square foot. 48 Common St is a home located in Norfolk County with nearby schools including Delaney Elementary School and Charles E Roderick.
Ownership History
Date
Name
Owned For
Owner Type
Purchase Details
Closed on
Jun 20, 2025
Sold by
Lmh Const Group Llc
Bought by
Devlin Bryan T
Current Estimated Value
Home Financials for this Owner
Home Financials are based on the most recent Mortgage that was taken out on this home.
Original Mortgage
$651,600
Outstanding Balance
$648,769
Interest Rate
6.76%
Mortgage Type
Purchase Money Mortgage
Estimated Equity
$128,157
Purchase Details
Closed on
Jan 31, 2025
Sold by
Jillson Enterprises Llc
Bought by
Lmh Const Group Llc
Purchase Details
Closed on
Feb 21, 2022
Sold by
Mirla Enterprises Llc
Bought by
Jillson Enterprises Llc
Purchase Details
Closed on
Nov 4, 2021
Sold by
Doyle Gail A
Bought by
Mirla Enterprises Llc
Home Financials for this Owner
Home Financials are based on the most recent Mortgage that was taken out on this home.
Original Mortgage
$440,000
Interest Rate
2.88%
Mortgage Type
New Conventional
Create a Home Valuation Report for This Property
The Home Valuation Report is an in-depth analysis detailing your home's value as well as a comparison with similar homes in the area
Home Values in the Area
Average Home Value in this Area
Purchase History
| Date | Buyer | Sale Price | Title Company |
|---|---|---|---|
| Devlin Bryan T | $814,500 | None Available | |
| Devlin Bryan T | $814,500 | None Available | |
| Lmh Const Group Llc | -- | None Available | |
| Lmh Const Group Llc | -- | None Available | |
| Jillson Enterprises Llc | $365,000 | None Available | |
| Jillson Enterprises Llc | $365,000 | None Available | |
| Mirla Enterprises Llc | $267,500 | None Available | |
| Mirla Enterprises Llc | $267,500 | None Available |
Source: Public Records
Mortgage History
| Date | Status | Borrower | Loan Amount |
|---|---|---|---|
| Open | Devlin Bryan T | $651,600 | |
| Closed | Devlin Bryan T | $651,600 | |
| Previous Owner | Mirla Enterprises Llc | $440,000 |
Source: Public Records
Tax History Compared to Growth
Tax History
| Year | Tax Paid | Tax Assessment Tax Assessment Total Assessment is a certain percentage of the fair market value that is determined by local assessors to be the total taxable value of land and additions on the property. | Land | Improvement |
|---|---|---|---|---|
| 2025 | $6,334 | $546,500 | $240,300 | $306,200 |
| 2024 | $6,442 | $536,800 | $240,300 | $296,500 |
| 2023 | $5,293 | $419,400 | $218,400 | $201,000 |
| 2022 | $3,525 | $257,850 | $212,400 | $45,450 |
| 2021 | $6,099 | $433,500 | $198,500 | $235,000 |
| 2020 | $4,807 | $337,300 | $151,500 | $185,800 |
| 2019 | $4,763 | $337,300 | $151,500 | $185,800 |
| 2018 | $4,920 | $345,500 | $151,600 | $193,900 |
| 2017 | $4,591 | $322,200 | $148,600 | $173,600 |
| 2016 | $4,492 | $314,600 | $144,300 | $170,300 |
| 2015 | $4,319 | $288,300 | $138,800 | $149,500 |
| 2014 | $4,719 | $308,200 | $133,500 | $174,700 |
Source: Public Records
Map
Nearby Homes
- 10 Nature View Dr
- 15 Nature View Dr
- 1 Lorraine Metcalf Dr
- 270 Dedham St
- 131 Creek St Unit 7
- 362 East St
- 319 Taunton St
- 11 Earle Stewart Ln
- Lot 3 - 14 Earle Stewart Ln
- Lot 1 - Blueberry 2 Car Plan at King Philip Estates
- Lot 8 - Blueberry 2 Car Plan at King Philip Estates
- Lot 5 - Hughes 2 car Plan at King Philip Estates
- Lot 6 - Blueberry 3 Car Plan at King Philip Estates
- Lot 2 - Camden 2 Car Plan at King Philip Estates
- Lot 7 - Cedar Plan at King Philip Estates
- Lot 4 - Hemingway 2 Car Plan at King Philip Estates
- Lot 3 - Blueberry 2 Car Plan at King Philip Estates
- 570 Franklin St
- 65 Pond St
- 246 Forest Grove Ave