
Seller's Agent in 2026
Kimberly Allard
Century 21 Professionals
(781) 844-8870
3 in this area
76 Total Sales
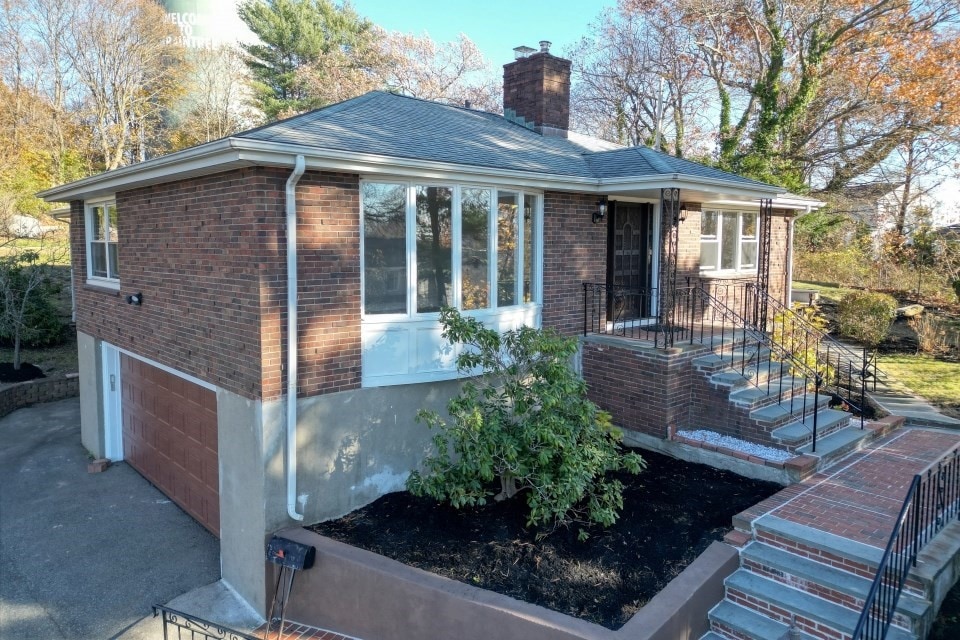


Celebrate the New Year HERE! This single-family home offers outstanding potential on a generous 25,500 sq ft lot w/a Fabulous Floor Plan. Enjoy ample backyard space, a lovely patio, 2 garage spaces, plus an extended driveway accommodating 6+ cars—ideal for guests or multiple vehicles. Inside, the thoughtful layout features refinished hardwood, three bedrooms with large closets, and two full bathrooms, with an optional half bath downstairs. Washer/Dryer on main level are included. The inviting living area includes a wood-burning fireplace, adding warmth and charm. The main level is freshly painted & boasts a renovated kitchen w/newer appliances, offering a bright & functional cooking space ready for everyday use or entertaining. The spacious lower level features a recreational room with a wet bar, ideal for gatherings or relaxation. With abundant space and the flexibility to customize, this property offers an exceptional opportunity to create your perfect next home. Available Now
| Date | Type | Sale Price | Title Company |
|---|---|---|---|
| Quit Claim Deed | $849,000 | -- | |
| Quit Claim Deed | -- | None Available | |
| Deed | $240,000 | -- |
| Date | Status | Loan Amount | Loan Type |
|---|---|---|---|
| Open | $679,200 | New Conventional | |
| Previous Owner | $154,000 | No Value Available | |
| Previous Owner | $168,000 | Purchase Money Mortgage |
| Date | Event | Price | List to Sale | Price per Sq Ft |
|---|---|---|---|---|
| 01/15/2026 01/15/26 | Sold | $849,000 | 0.0% | $302 / Sq Ft |
| 12/08/2025 12/08/25 | Pending | -- | -- | -- |
| 12/03/2025 12/03/25 | For Sale | $849,000 | -- | $302 / Sq Ft |
| Year | Tax Paid | Tax Assessment Tax Assessment Total Assessment is a certain percentage of the fair market value that is determined by local assessors to be the total taxable value of land and additions on the property. | Land | Improvement |
|---|---|---|---|---|
| 2025 | $7,961 | $797,700 | $475,100 | $322,600 |
| 2024 | $7,260 | $765,800 | $445,400 | $320,400 |
| 2023 | $6,760 | $692,600 | $392,000 | $300,600 |
| 2022 | $6,537 | $657,000 | $356,400 | $300,600 |
| 2021 | $5,785 | $581,400 | $300,500 | $280,900 |
| 2020 | $5,733 | $581,400 | $300,500 | $280,900 |
| 2019 | $5,555 | $550,500 | $300,500 | $250,000 |
| 2018 | $5,287 | $501,600 | $261,400 | $240,200 |
| 2017 | $5,132 | $477,800 | $237,600 | $240,200 |
| 2016 | $4,920 | $448,100 | $213,900 | $234,200 |
| 2015 | $4,907 | $443,300 | $209,100 | $234,200 |
| 2014 | $4,542 | $397,700 | $192,500 | $205,200 |
Seller's Agent in 2026
Kimberly Allard
Century 21 Professionals
(781) 844-8870
3 in this area
76 Total Sales
D
Seller Co-Listing Agent in 2026
Dawn Marsico
Century 21 Professionals
1 in this area
14 Total Sales
Buyer's Agent in 2026
Meghan Santoro
Reference Real Estate
(617) 372-3187
1 in this area
11 Total Sales
Source: MLS Property Information Network (MLS PIN)
MLS Number: 73459565
APN: BRAI-002073-000000-000023
Disclaimer: Certain information contained herein is derived from information provided by parties other than Homes.com. All information provided is deemed reliable, but is not guaranteed to be accurate and should be independently verified.
![]() The property listing data and information, or the Images, set forth herein were provided to MLS Property Information Network, Inc. from third party sources, including sellers, lessors and public records, and were compiled by MLS Property Information Network, Inc. The property listing data and information, and the Images, are for the personal, non-commercial use of consumers having a good faith interest in purchasing or leasing listed properties of the type displayed to them and may not be used for any purpose other than to identify prospective properties which such consumers may have a good faith interest in purchasing or leasing. MLS Property Information Network, Inc. and its subscribers disclaim any and all representations and warranties as to the accuracy of the property listing data and information, or as to the accuracy of any of the Images, set forth herein.
The property listing data and information, or the Images, set forth herein were provided to MLS Property Information Network, Inc. from third party sources, including sellers, lessors and public records, and were compiled by MLS Property Information Network, Inc. The property listing data and information, and the Images, are for the personal, non-commercial use of consumers having a good faith interest in purchasing or leasing listed properties of the type displayed to them and may not be used for any purpose other than to identify prospective properties which such consumers may have a good faith interest in purchasing or leasing. MLS Property Information Network, Inc. and its subscribers disclaim any and all representations and warranties as to the accuracy of the property listing data and information, or as to the accuracy of any of the Images, set forth herein.
Ask me questions while you tour the home.