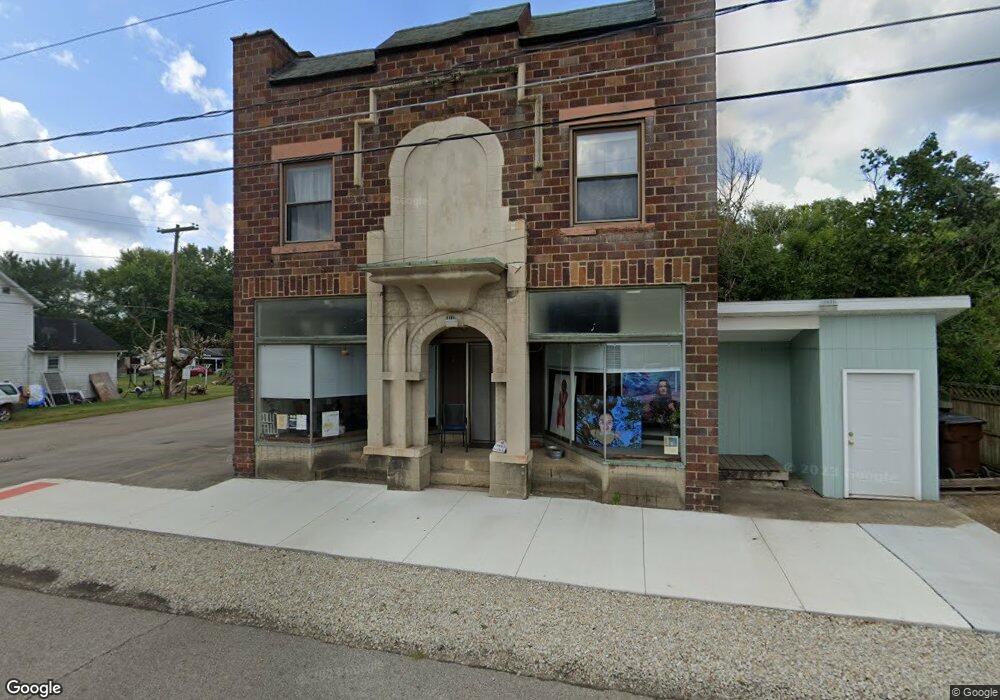
48 Converse St Chauncey, OH 45719
Estimated Value: $122,445
--
Bed
--
Bath
5,364
Sq Ft
$23/Sq Ft
Est. Value
About This Home
This property at 48 Converse St features a 1-bedroom, 1-bathroom layout within a square footage range of 230 to 600 sq. ft. The living room offers a comfortable space for relaxation, while the bedroom provides privacy and ample room for furnishings. The bathroom is equipped with essential fixtures for convenience. Key amenities include air conditioning for climate control and an in-unit washer/dryer for laundry needs. The property is smoke-free, ensuring a clean living environment. The exterior is well-maintained, contributing to a pleasant overall appearance. The rental price is available upon request. This listing is ideal for individuals seeking a compact and functional living space.
Ownership History
Date
Name
Owned For
Owner Type
Purchase Details
Closed on
Sep 30, 2015
Sold by
Henry Willaim and Henry Willaim K
Bought by
Dover Enterprises Ltd
Current Estimated Value
Create a Home Valuation Report for This Property
The Home Valuation Report is an in-depth analysis detailing your home's value as well as a comparison with similar homes in the area
Home Values in the Area
Average Home Value in this Area
Purchase History
| Date | Buyer | Sale Price | Title Company |
|---|---|---|---|
| Dover Enterprises Ltd | $60,000 | Secure Title Services |
Source: Public Records
Property History
| Date | Event | Price | List to Sale | Price per Sq Ft |
|---|---|---|---|---|
| 02/10/2025 02/10/25 | Off Market | -- | -- | -- |
| 01/30/2025 01/30/25 | For Rent | -- | -- | -- |
Tax History Compared to Growth
Tax History
| Year | Tax Paid | Tax Assessment Tax Assessment Total Assessment is a certain percentage of the fair market value that is determined by local assessors to be the total taxable value of land and additions on the property. | Land | Improvement |
|---|---|---|---|---|
| 2024 | $1,397 | $20,540 | $1,380 | $19,160 |
| 2023 | $1,321 | $20,540 | $1,380 | $19,160 |
| 2022 | $1,330 | $20,310 | $1,150 | $19,160 |
| 2021 | $1,328 | $20,310 | $1,150 | $19,160 |
| 2020 | $1,257 | $20,310 | $1,150 | $19,160 |
| 2019 | $1,193 | $18,080 | $1,030 | $17,050 |
| 2018 | $1,177 | $18,080 | $1,030 | $17,050 |
| 2017 | $1,130 | $18,080 | $1,030 | $17,050 |
| 2016 | $1,101 | $17,160 | $1,030 | $16,130 |
| 2015 | $1,673 | $16,790 | $1,120 | $15,670 |
| 2014 | $1,673 | $16,790 | $1,120 | $15,670 |
| 2013 | $1,498 | $15,420 | $1,060 | $14,360 |
Source: Public Records
Map
Nearby Homes
- 156 N Monroe
- 59 Mill St
- 8258 W Bailey Rd
- 14611 State Route 13
- 12819 Upper River
- 0 Salt Creek Rd
- 90 Main St
- 57 Ohio Ave
- 5 Oak St
- 27 North St
- 11676 Channingway Blvd
- 36 Johnson Rd
- 35 Johnson Rd
- 7 W 2nd St
- 0 Shady Ln
- 0 Carol Ln Unit 2433046
- 0 S Plains Rd
- 4-20 Beech Rd
- 6559 Poston Rd
- 0 Lemaster Rd Unit 23368524