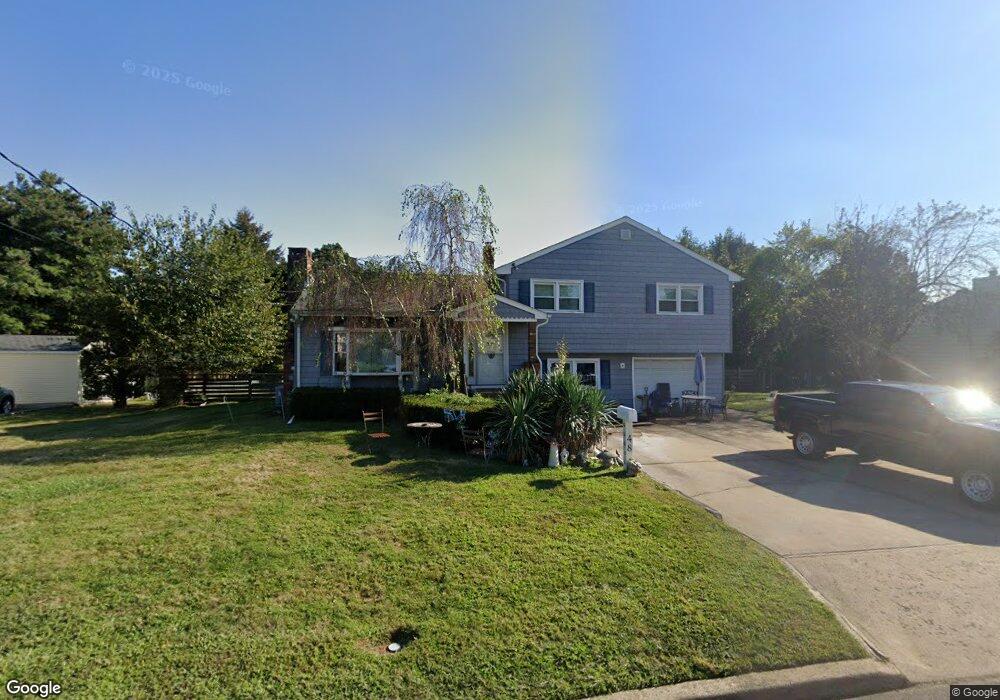
48 Cooper Ave West Long Branch, NJ 07764
Estimated Value: $1,011,033 - $1,474,000
3
Beds
3
Baths
1,652
Sq Ft
$771/Sq Ft
Est. Value
About This Home
This home is located at 48 Cooper Ave, West Long Branch, NJ 07764 and is currently estimated at $1,274,258, approximately $771 per square foot. 48 Cooper Ave is a home located in Monmouth County with nearby schools including Betty McElmon Elementary School, Frank Antonides School, and Shore Regional High School.
Ownership History
Date
Name
Owned For
Owner Type
Purchase Details
Closed on
Jul 30, 1996
Sold by
Ifrah Jeff
Bought by
Serra Deborah
Current Estimated Value
Home Financials for this Owner
Home Financials are based on the most recent Mortgage that was taken out on this home.
Original Mortgage
$21,000
Outstanding Balance
$1,669
Interest Rate
8.27%
Estimated Equity
$1,272,589
Purchase Details
Closed on
Jun 13, 1994
Sold by
Liu Jiu Yung
Bought by
Ifrah Jeff and Ifrah Barbara
Home Financials for this Owner
Home Financials are based on the most recent Mortgage that was taken out on this home.
Original Mortgage
$155,000
Interest Rate
8.51%
Mortgage Type
VA
Create a Home Valuation Report for This Property
The Home Valuation Report is an in-depth analysis detailing your home's value as well as a comparison with similar homes in the area
Home Values in the Area
Average Home Value in this Area
Purchase History
| Date | Buyer | Sale Price | Title Company |
|---|---|---|---|
| Serra Deborah | $232,500 | -- | |
| Ifrah Jeff | $230,000 | -- |
Source: Public Records
Mortgage History
| Date | Status | Borrower | Loan Amount |
|---|---|---|---|
| Open | Serra Deborah | $21,000 | |
| Previous Owner | Ifrah Jeff | $155,000 |
Source: Public Records
Tax History Compared to Growth
Tax History
| Year | Tax Paid | Tax Assessment Tax Assessment Total Assessment is a certain percentage of the fair market value that is determined by local assessors to be the total taxable value of land and additions on the property. | Land | Improvement |
|---|---|---|---|---|
| 2025 | $11,655 | $913,800 | $591,300 | $322,500 |
| 2024 | $13,295 | $894,500 | $577,900 | $316,600 |
| 2023 | $13,295 | $951,700 | $642,500 | $309,200 |
| 2022 | $10,742 | $830,000 | $528,500 | $301,500 |
| 2021 | $10,742 | $555,700 | $338,000 | $217,700 |
| 2020 | $10,390 | $505,600 | $292,800 | $212,800 |
| 2019 | $9,699 | $474,500 | $263,000 | $211,500 |
| 2018 | $9,120 | $431,000 | $227,500 | $203,500 |
| 2017 | $8,988 | $405,600 | $208,300 | $197,300 |
| 2016 | $8,356 | $384,700 | $222,500 | $162,200 |
| 2015 | $8,058 | $370,500 | $212,500 | $158,000 |
| 2014 | $8,117 | $348,200 | $197,500 | $150,700 |
Source: Public Records
Map
Nearby Homes