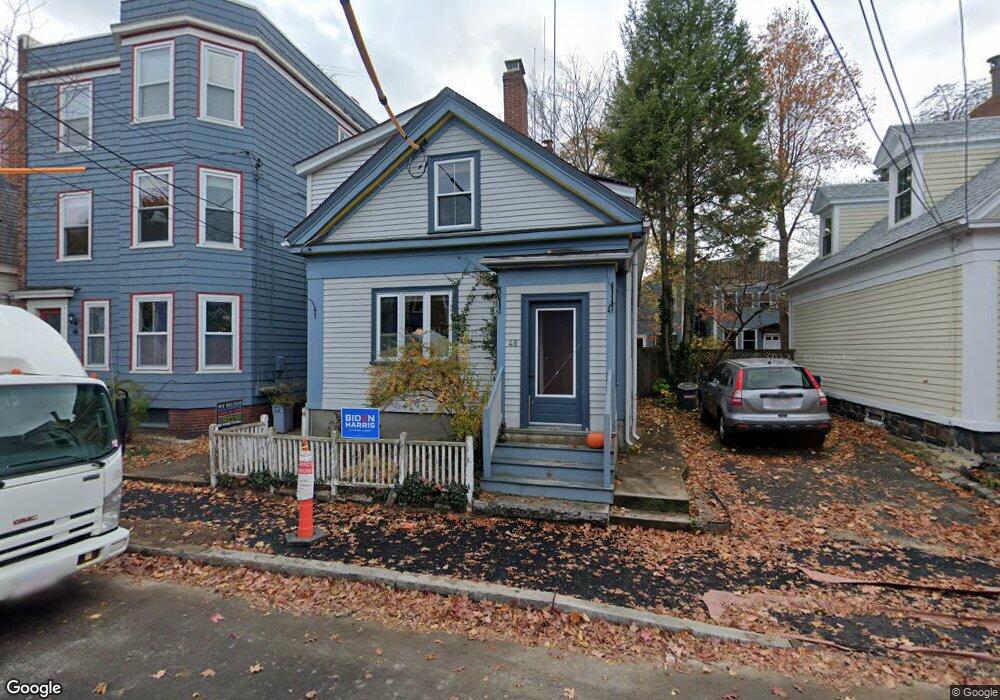
48 Cottage St Unit SF Cambridge, MA 02139
Cambridgeport NeighborhoodEstimated Value: $1,506,000 - $1,820,000
3
Beds
2
Baths
2,170
Sq Ft
$757/Sq Ft
Est. Value
About This Home
This home is located at 48 Cottage St Unit SF, Cambridge, MA 02139 and is currently estimated at $1,642,064, approximately $756 per square foot. 48 Cottage St Unit SF is a home located in Middlesex County with nearby schools including Prospect Hill Academy Charter School.
Ownership History
Date
Name
Owned For
Owner Type
Purchase Details
Closed on
Mar 14, 2019
Sold by
Beeuwkes-Baker Elizabeth and Baker Kenneth J
Bought by
Kenneth J Baker Ret
Current Estimated Value
Purchase Details
Closed on
Apr 13, 2004
Sold by
Beeuwkes Elizabeth
Bought by
Baker Elizabeth Beeuw and Baker Kenneth James
Purchase Details
Closed on
Jan 6, 1997
Sold by
Sullivan John M
Bought by
Welch Douglas K and Gutheil Caitlin M
Home Financials for this Owner
Home Financials are based on the most recent Mortgage that was taken out on this home.
Original Mortgage
$196,000
Interest Rate
7.48%
Mortgage Type
Purchase Money Mortgage
Purchase Details
Closed on
Jun 27, 1994
Sold by
Sullivan James F and Sullivan Jean E
Bought by
Sullivan John M
Home Financials for this Owner
Home Financials are based on the most recent Mortgage that was taken out on this home.
Original Mortgage
$147,000
Interest Rate
8.74%
Mortgage Type
Purchase Money Mortgage
Create a Home Valuation Report for This Property
The Home Valuation Report is an in-depth analysis detailing your home's value as well as a comparison with similar homes in the area
Home Values in the Area
Average Home Value in this Area
Purchase History
| Date | Buyer | Sale Price | Title Company |
|---|---|---|---|
| Kenneth J Baker Ret | -- | -- | |
| Baker Elizabeth Beeuw | -- | -- | |
| Welch Douglas K | $246,000 | -- | |
| Sullivan John M | $147,000 | -- |
Source: Public Records
Mortgage History
| Date | Status | Borrower | Loan Amount |
|---|---|---|---|
| Previous Owner | Welch Douglas K | $228,000 | |
| Previous Owner | Welch Douglas K | $196,000 | |
| Previous Owner | Sullivan John M | $147,000 |
Source: Public Records
Tax History Compared to Growth
Tax History
| Year | Tax Paid | Tax Assessment Tax Assessment Total Assessment is a certain percentage of the fair market value that is determined by local assessors to be the total taxable value of land and additions on the property. | Land | Improvement |
|---|---|---|---|---|
| 2025 | $9,247 | $1,456,200 | $832,300 | $623,900 |
| 2024 | $8,851 | $1,495,100 | $898,000 | $597,100 |
| 2023 | $8,234 | $1,405,100 | $889,000 | $516,100 |
| 2022 | $7,974 | $1,346,900 | $890,400 | $456,500 |
| 2021 | $7,412 | $1,267,000 | $841,600 | $425,400 |
| 2020 | $6,917 | $1,203,000 | $800,200 | $402,800 |
| 2019 | $6,359 | $1,070,600 | $697,900 | $372,700 |
| 2018 | $6,188 | $958,100 | $613,600 | $344,500 |
| 2017 | $6,031 | $929,200 | $601,600 | $327,600 |
| 2016 | $5,517 | $789,200 | $475,300 | $313,900 |
| 2015 | $5,435 | $695,000 | $415,100 | $279,900 |
| 2014 | $5,615 | $670,100 | $394,100 | $276,000 |
Source: Public Records
Map
Nearby Homes
- 73 River St Unit 4B
- 1 Jay St
- 300 Franklin St Unit 5
- 300 Franklin St Unit 1
- 300 Franklin St Unit 2
- 53 Jay St Unit 2
- 127 Auburn St
- 129 Auburn St
- 6-8 Watson St Unit 8
- 125 Brookline St Unit 4
- 8 Watson St Unit 8
- 174 Hamilton St
- 161 Hamilton St
- 863 Massachusetts Ave Unit 25
- 12 Inman St Unit 55
- 131 Erie St Unit 3
- 131 Erie St
- 214 Allston St
- 2 Hingham St
- 149A Bishop Allen Unit A
- 48 Cottage St
- 48 Cottage St Unit 48
- 46 Cottage St Unit 3
- 46 Cottage St Unit 2
- 46 Cottage St Unit 1
- 50 Cottage St
- 50 Cottage St Unit 1
- 44 Cottage St
- 44 Cottage St
- 5 Pleasant Place
- 44 Pleasant St
- 3 1/2 Pleasant Place Unit 2
- 3 1/2 Pleasant Place Unit 1
- 3 Pleasant Place Unit 3
- 7 Pleasant Place
- 7 Pleasant Place Unit 3
- 47 Cottage St Unit 3
- 47 Cottage St Unit 2
- 47 Cottage St Unit 1
- 49 Cottage St