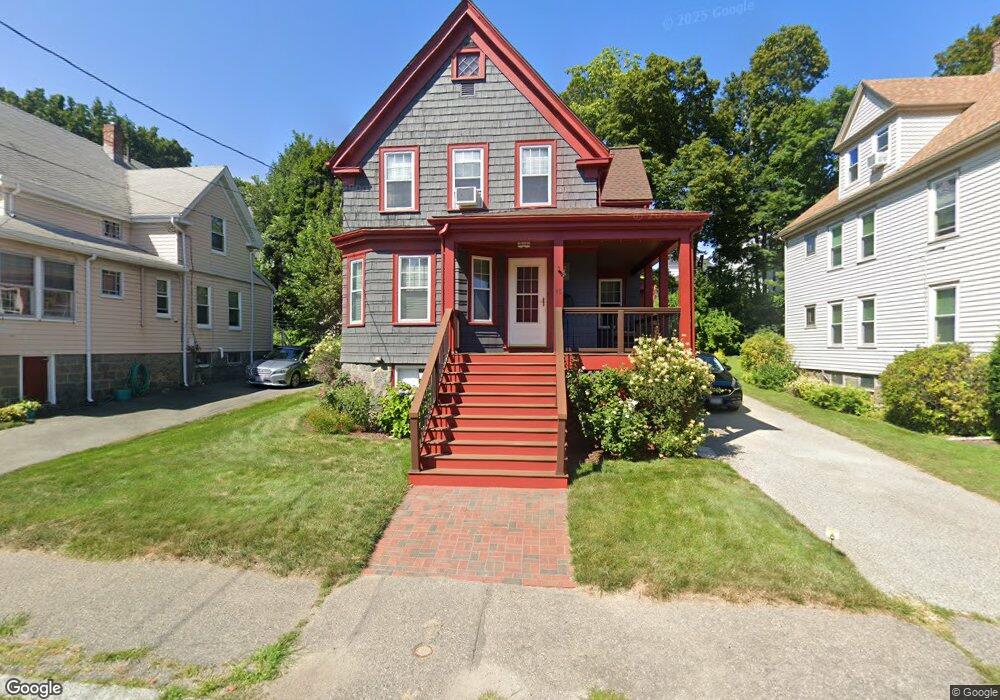
48 Cranch St Quincy, MA 02169
Quincy Center NeighborhoodEstimated Value: $633,000 - $694,000
3
Beds
2
Baths
1,152
Sq Ft
$578/Sq Ft
Est. Value
About This Home
This home is located at 48 Cranch St, Quincy, MA 02169 and is currently estimated at $665,406, approximately $577 per square foot. 48 Cranch St is a home located in Norfolk County with nearby schools including Charles A. Bernazzani Elementary School, Central Middle School, and Quincy High School.
Ownership History
Date
Name
Owned For
Owner Type
Purchase Details
Closed on
Jul 27, 2009
Sold by
Woods Michael P and Woods Donna M
Bought by
Obrien Matthew B
Current Estimated Value
Home Financials for this Owner
Home Financials are based on the most recent Mortgage that was taken out on this home.
Original Mortgage
$189,600
Outstanding Balance
$125,932
Interest Rate
5.58%
Mortgage Type
Purchase Money Mortgage
Estimated Equity
$539,474
Purchase Details
Closed on
Jul 17, 2002
Sold by
Anderson George
Bought by
Woods Michael P and Woods Donna M
Home Financials for this Owner
Home Financials are based on the most recent Mortgage that was taken out on this home.
Original Mortgage
$189,150
Interest Rate
6.73%
Mortgage Type
Purchase Money Mortgage
Create a Home Valuation Report for This Property
The Home Valuation Report is an in-depth analysis detailing your home's value as well as a comparison with similar homes in the area
Home Values in the Area
Average Home Value in this Area
Purchase History
| Date | Buyer | Sale Price | Title Company |
|---|---|---|---|
| Obrien Matthew B | $348,000 | -- | |
| Woods Michael P | $195,000 | -- |
Source: Public Records
Mortgage History
| Date | Status | Borrower | Loan Amount |
|---|---|---|---|
| Open | Obrien Matthew B | $189,600 | |
| Previous Owner | Woods Michael P | $189,150 |
Source: Public Records
Tax History Compared to Growth
Tax History
| Year | Tax Paid | Tax Assessment Tax Assessment Total Assessment is a certain percentage of the fair market value that is determined by local assessors to be the total taxable value of land and additions on the property. | Land | Improvement |
|---|---|---|---|---|
| 2025 | $5,999 | $520,300 | $267,700 | $252,600 |
| 2024 | $5,610 | $497,800 | $254,900 | $242,900 |
| 2023 | $5,140 | $461,800 | $231,800 | $230,000 |
| 2022 | $5,204 | $434,400 | $210,700 | $223,700 |
| 2021 | $4,922 | $405,400 | $210,700 | $194,700 |
| 2020 | $4,650 | $374,100 | $200,700 | $173,400 |
| 2019 | $4,515 | $359,800 | $189,300 | $170,500 |
| 2018 | $4,578 | $343,200 | $189,300 | $153,900 |
| 2017 | $4,577 | $323,000 | $180,300 | $142,700 |
| 2016 | $4,386 | $305,400 | $171,700 | $133,700 |
| 2015 | $4,295 | $294,200 | $171,700 | $122,500 |
| 2014 | $4,069 | $273,800 | $163,500 | $110,300 |
Source: Public Records
Map
Nearby Homes
- 73 Cranch St Unit 73
- 118 Dimmock St
- 293 Whitwell St
- 195 Thomas Burgin Pkwy Unit 205
- 165 Granite St
- 215 Thomas Burgin Pkwy Unit 35
- 1 Cityview Ln Unit 204
- 1 Cityview Ln Unit 506
- 1 Cityview Ln Unit 303
- 25 Carrolls Ln
- 46 Suomi Rd
- 46 Suomi Rd Unit 46
- 312 Adams St
- 18 Cliveden St Unit 201W
- 94 Brook Rd Unit 3
- 77 Adams St Unit 610
- 2 Cliveden St Unit 601E
- 2 Cliveden St Unit 305E
- 20 Whitney Rd
- 20 Whitney Rd Unit 307
- 46 Cranch St
- 56 Cranch St Unit 3
- 54 Cranch St
- 54 Cranch St Unit 1
- 54 Cranch St Unit 2
- 58 Cranch St
- 42 Cranch St
- 42 Cranch St Unit 1
- 42 Cranch St
- 42 Cranch St Unit 2
- 193 Whitwell St
- 189 Whitwell St
- 189 Whitwell St Unit 1
- 189 Whitwell St Unit 3
- 195 Whitwell St
- 51 Cranch St
- 53 Cranch St
- 53 Cranch St Unit 3
- 53 Cranch St Unit 55
- 53 Cranch St Unit 53