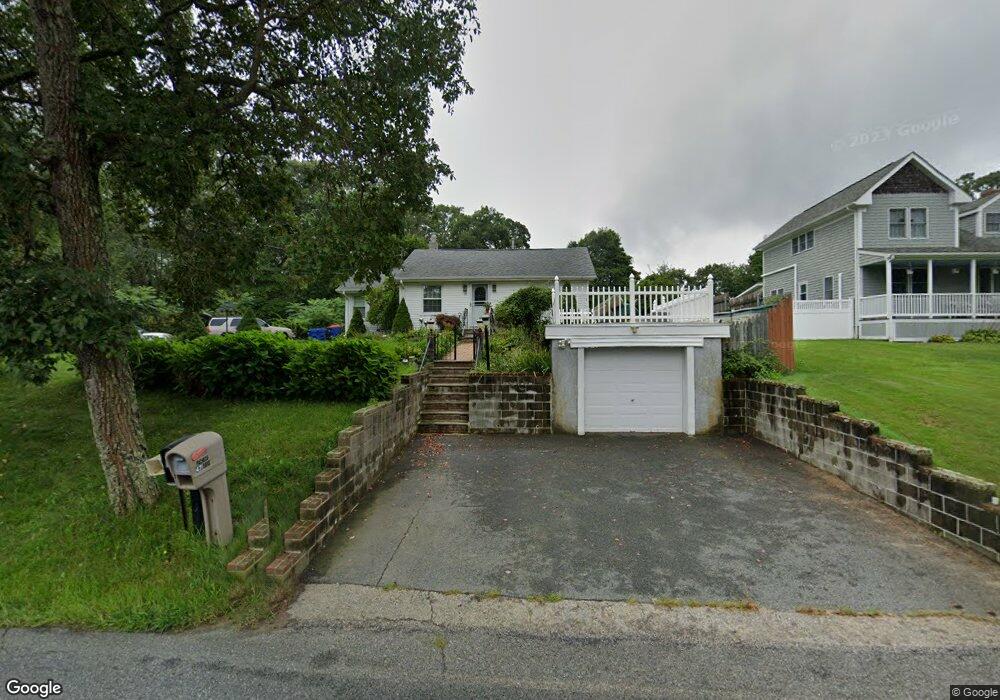
48 Davis Rd Westport, MA 02790
North Westport NeighborhoodEstimated Value: $439,000 - $539,000
2
Beds
1
Bath
1,458
Sq Ft
$330/Sq Ft
Est. Value
About This Home
This home is located at 48 Davis Rd, Westport, MA 02790 and is currently estimated at $481,584, approximately $330 per square foot. 48 Davis Rd is a home located in Bristol County with nearby schools including Alice A. Macomber Primary School, Westport Elementary School, and Westport Middle-High School.
Ownership History
Date
Name
Owned For
Owner Type
Purchase Details
Closed on
Apr 24, 1992
Sold by
Eckardt Calrence J and Eckardt Sophie
Bought by
Camara Daniel E and Camara Margarida C
Current Estimated Value
Home Financials for this Owner
Home Financials are based on the most recent Mortgage that was taken out on this home.
Original Mortgage
$89,000
Interest Rate
8.78%
Mortgage Type
Purchase Money Mortgage
Create a Home Valuation Report for This Property
The Home Valuation Report is an in-depth analysis detailing your home's value as well as a comparison with similar homes in the area
Home Values in the Area
Average Home Value in this Area
Purchase History
| Date | Buyer | Sale Price | Title Company |
|---|---|---|---|
| Camara Daniel E | $99,000 | -- |
Source: Public Records
Mortgage History
| Date | Status | Borrower | Loan Amount |
|---|---|---|---|
| Open | Camara Daniel E | $110,000 | |
| Closed | Camara Daniel E | $97,000 | |
| Closed | Camara Daniel E | $20,000 | |
| Closed | Camara Daniel E | $89,000 |
Source: Public Records
Tax History Compared to Growth
Tax History
| Year | Tax Paid | Tax Assessment Tax Assessment Total Assessment is a certain percentage of the fair market value that is determined by local assessors to be the total taxable value of land and additions on the property. | Land | Improvement |
|---|---|---|---|---|
| 2025 | $2,951 | $396,100 | $164,100 | $232,000 |
| 2024 | $2,902 | $375,400 | $145,700 | $229,700 |
| 2023 | $2,638 | $323,300 | $132,700 | $190,600 |
| 2022 | $2,501 | $294,900 | $132,700 | $162,200 |
| 2021 | $2,311 | $268,100 | $109,700 | $158,400 |
| 2020 | $2,223 | $263,700 | $105,300 | $158,400 |
| 2019 | $2,197 | $265,700 | $105,300 | $160,400 |
| 2018 | $1,921 | $235,100 | $111,800 | $123,300 |
| 2017 | $1,856 | $232,900 | $111,800 | $121,100 |
| 2016 | $1,795 | $226,900 | $111,800 | $115,100 |
| 2015 | $1,709 | $215,500 | $111,800 | $103,700 |
Source: Public Records
Map
Nearby Homes