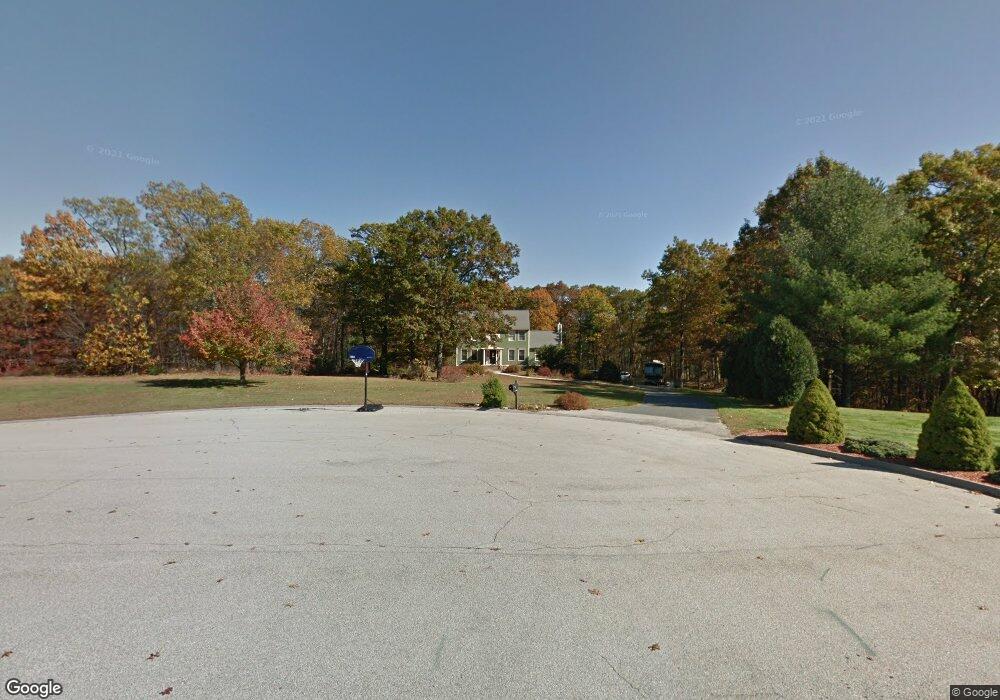
48 Douglas Hill Way Douglas, MA 01516
Estimated Value: $633,000 - $679,000
3
Beds
3
Baths
1,816
Sq Ft
$357/Sq Ft
Est. Value
About This Home
This home is located at 48 Douglas Hill Way, Douglas, MA 01516 and is currently estimated at $647,799, approximately $356 per square foot. 48 Douglas Hill Way is a home located in Worcester County with nearby schools including Douglas Primary School, Douglas Middle School, and Douglas High School.
Ownership History
Date
Name
Owned For
Owner Type
Purchase Details
Closed on
Dec 23, 2024
Sold by
Rindone John and Rindone Ellen M
Bought by
Rindone Ft and Rindone
Current Estimated Value
Purchase Details
Closed on
Apr 21, 2006
Sold by
Nolen Kerry L and Nolen Peter S
Bought by
Rindone Ellen M and Rindone John
Home Financials for this Owner
Home Financials are based on the most recent Mortgage that was taken out on this home.
Original Mortgage
$180,000
Interest Rate
6.37%
Mortgage Type
Purchase Money Mortgage
Purchase Details
Closed on
Aug 22, 1997
Sold by
Harrington John G and Harrington Elizabeth
Bought by
Nolen Peter S and Nolen Kerry L
Purchase Details
Closed on
Jan 24, 1996
Sold by
Douglas Hills Corp
Bought by
Harrington John and Harrington Elizabeth
Create a Home Valuation Report for This Property
The Home Valuation Report is an in-depth analysis detailing your home's value as well as a comparison with similar homes in the area
Home Values in the Area
Average Home Value in this Area
Purchase History
| Date | Buyer | Sale Price | Title Company |
|---|---|---|---|
| Rindone Ft | -- | None Available | |
| Rindone Ft | -- | None Available | |
| Rindone Ellen M | $365,000 | -- | |
| Rindone Ellen M | $365,000 | -- | |
| Nolen Peter S | $193,000 | -- | |
| Nolen Peter S | $193,000 | -- | |
| Harrington John | $182,726 | -- | |
| Harrington John | $182,726 | -- |
Source: Public Records
Mortgage History
| Date | Status | Borrower | Loan Amount |
|---|---|---|---|
| Previous Owner | Harrington John | $173,000 | |
| Previous Owner | Rindone Ellen M | $180,000 | |
| Previous Owner | Harrington John | $221,900 |
Source: Public Records
Tax History Compared to Growth
Tax History
| Year | Tax Paid | Tax Assessment Tax Assessment Total Assessment is a certain percentage of the fair market value that is determined by local assessors to be the total taxable value of land and additions on the property. | Land | Improvement |
|---|---|---|---|---|
| 2025 | $6,621 | $502,700 | $134,800 | $367,900 |
| 2024 | $6,477 | $479,100 | $122,600 | $356,500 |
| 2023 | $6,382 | $444,400 | $122,600 | $321,800 |
| 2022 | $6,343 | $388,200 | $102,300 | $285,900 |
| 2021 | $5,374 | $372,900 | $97,400 | $275,500 |
| 2020 | $6,104 | $359,500 | $97,400 | $262,100 |
| 2019 | $4,899 | $340,700 | $97,400 | $243,300 |
| 2018 | $2,807 | $331,500 | $97,400 | $234,100 |
| 2017 | $3,011 | $309,000 | $102,300 | $206,700 |
| 2016 | $5,033 | $299,200 | $102,300 | $196,900 |
| 2015 | $4,925 | $299,200 | $102,300 | $196,900 |
Source: Public Records
Map
Nearby Homes
- 44 Douglas Hill Way
- 41 Douglas Hill Way
- 38 Douglas Hill Way
- 37 Douglas Hill Way
- 34 Douglas Hill Way
- 33 Douglas Hill Way
- 27 Douglas Hill Way
- 30 Douglas Hill Way
- 17 Douglas Hill Way
- 26 Douglas Hill Way
- 129 NW Main St
- 125 NW Main St
- 141 N West Main St
- 141 NW Main St
- 155 NW Main St
- 9 Whitin Heights
- 7 Whitin Heights
- 1 Whitin Heights
- 175 NW Main St
- 3 Whitin Heights