Estimated Value: $347,000 - $460,000
Studio
--
Bath
1,294
Sq Ft
$318/Sq Ft
Est. Value
About This Home
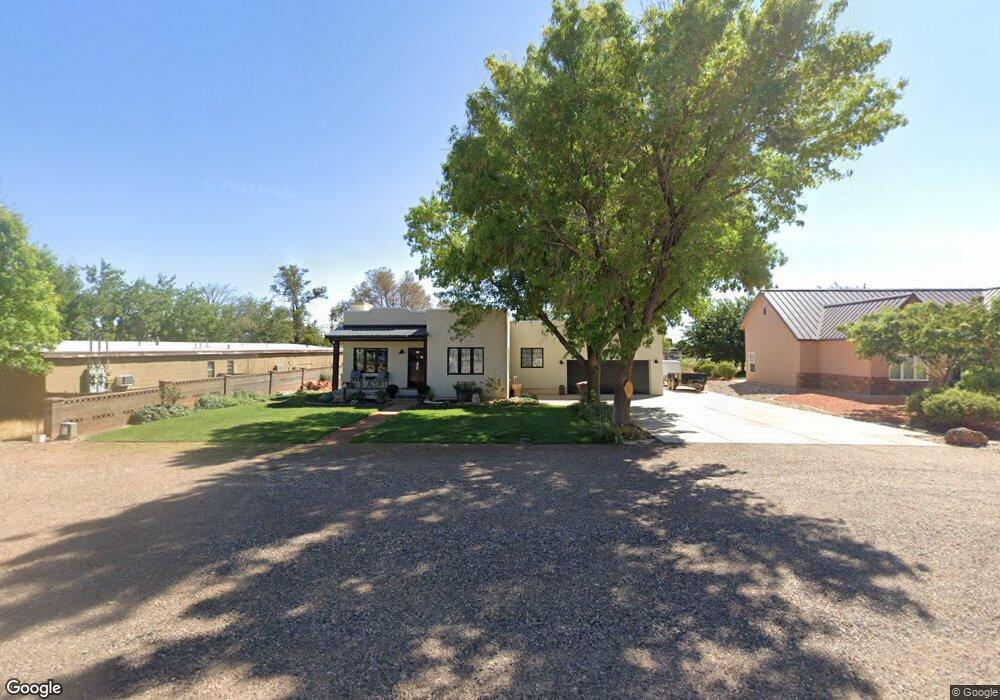
This home is located at 48 E 400 S, Kanab, UT 84741 and is currently estimated at $411,552, approximately $318 per square foot. 48 E 400 S is a home located in Kane County with nearby schools including Kanab Elementary School, Kanab Middle School, and Kanab High School.
Ownership History
Date
Name
Owned For
Owner Type
Purchase Details
Closed on
May 6, 2015
Sold by
Finley J Finley J and Bunting Finley James
Bought by
Bunting Peggy Jo
Current Estimated Value
Home Financials for this Owner
Home Financials are based on the most recent Mortgage that was taken out on this home.
Original Mortgage
$80,000
Outstanding Balance
$61,517
Interest Rate
3.63%
Mortgage Type
Unknown
Estimated Equity
$350,035
Purchase Details
Closed on
Jul 3, 2014
Sold by
Peggy Jo Peggy Jo
Bought by
Bunting Finley Ramon and Romon & Ann Bunting Family Revocable Tr
Create a Home Valuation Report for This Property
The Home Valuation Report is an in-depth analysis detailing your home's value as well as a comparison with similar homes in the area
Home Values in the Area
Average Home Value in this Area
Purchase History
| Date | Buyer | Sale Price | Title Company |
|---|---|---|---|
| Bunting Peggy Jo | -- | -- | |
| Bunting Finley Ramon | -- | -- |
Source: Public Records
Mortgage History
| Date | Status | Borrower | Loan Amount |
|---|---|---|---|
| Open | Bunting Peggy Jo | $80,000 | |
| Closed | Bunting Peggy Jo | $80,000 |
Source: Public Records
Tax History
| Year | Tax Paid | Tax Assessment Tax Assessment Total Assessment is a certain percentage of the fair market value that is determined by local assessors to be the total taxable value of land and additions on the property. | Land | Improvement |
|---|---|---|---|---|
| 2025 | $1,935 | $410,061 | $115,220 | $294,841 |
| 2024 | $2,056 | $238,958 | $52,373 | $186,585 |
| 2023 | $1,843 | $219,502 | $49,879 | $169,623 |
| 2022 | $1,708 | $201,402 | $38,369 | $163,033 |
| 2021 | $1,184 | $209,486 | $54,450 | $155,036 |
| 2020 | $1,148 | $197,294 | $49,500 | $147,794 |
| 2019 | $820 | $137,116 | $47,520 | $89,596 |
| 2018 | $779 | $129,196 | $39,600 | $89,596 |
| 2017 | $738 | $116,805 | $36,000 | $80,805 |
| 2016 | $672 | $103,346 | $36,000 | $67,346 |
| 2015 | $1,331 | $105,188 | $42,300 | $62,888 |
| 2014 | $1,331 | $112,031 | $47,195 | $64,836 |
| 2013 | -- | $112,031 | $0 | $0 |
Source: Public Records
Map
Nearby Homes
- 476 S 100 E
- 325 S Main St
- 611 S 175 E
- 80 E Red Shadow Cir
- 176 S 100 E
- 300 S 300 E Unit A5
- 818 S Highway 89a
- 275 E 650 S Unit 5
- 1117 S Terrel Dr
- 141 W 100 S
- 528 S 410 E
- 380 E 200 S
- 235 W 100 S
- 0 100 Unit 1409231
- 2550 S
- 70 N Main St
- 425 W Momori Cir Unit A-6
- 425 W Momori Cir Unit B2
- 425 W Momori Cir Unit B1
- 425 W Momori Cir Unit A-5
Your Personal Tour Guide
Ask me questions while you tour the home.