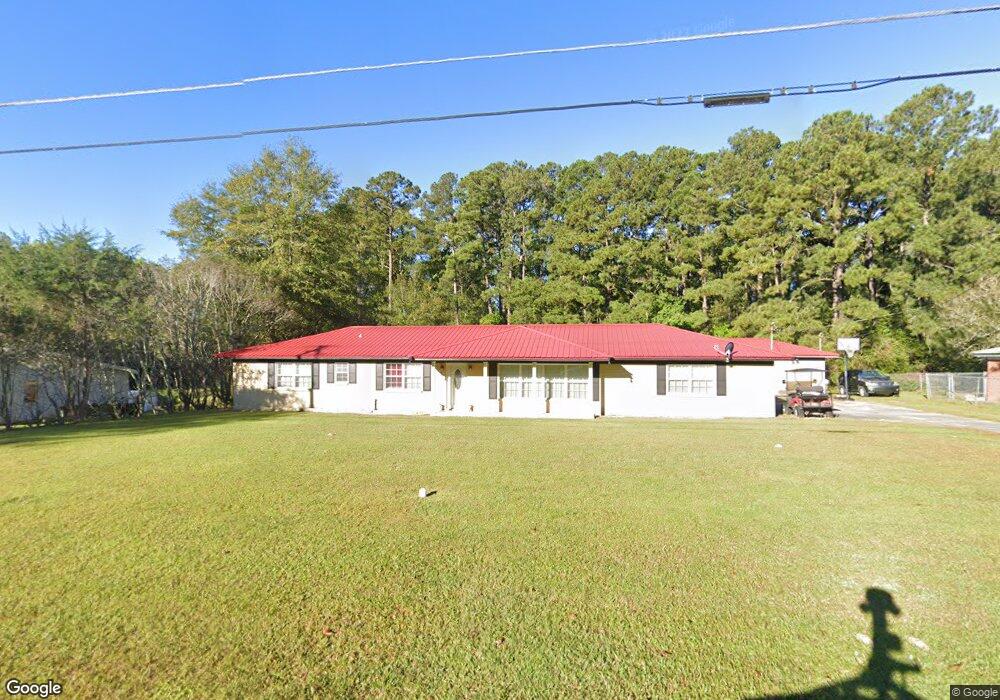
48 E Plum St Hazlehurst, GA 31539
Estimated Value: $183,027 - $271,000
3
Beds
2
Baths
1,560
Sq Ft
$134/Sq Ft
Est. Value
About This Home
This home is located at 48 E Plum St, Hazlehurst, GA 31539 and is currently estimated at $209,257, approximately $134 per square foot. 48 E Plum St is a home located in Jeff Davis County with nearby schools including Jeff Davis Primary School, Jeff Davis Elementary School, and Jeff Davis Middle School.
Ownership History
Date
Name
Owned For
Owner Type
Purchase Details
Closed on
Mar 8, 2013
Sold by
Holliday Tara L
Bought by
Patterson Mark Anthony
Current Estimated Value
Home Financials for this Owner
Home Financials are based on the most recent Mortgage that was taken out on this home.
Original Mortgage
$112,891
Outstanding Balance
$78,692
Interest Rate
3.5%
Mortgage Type
FHA
Estimated Equity
$130,565
Purchase Details
Closed on
Apr 28, 2010
Sold by
Aycock Glynn Thomas
Bought by
Williams Tara L
Home Financials for this Owner
Home Financials are based on the most recent Mortgage that was taken out on this home.
Original Mortgage
$101,529
Interest Rate
5.06%
Mortgage Type
New Conventional
Purchase Details
Closed on
Oct 26, 1988
Bought by
Aycock Glynn T
Purchase Details
Closed on
Jan 1, 1964
Bought by
Aycock Pauline D Mrs
Create a Home Valuation Report for This Property
The Home Valuation Report is an in-depth analysis detailing your home's value as well as a comparison with similar homes in the area
Home Values in the Area
Average Home Value in this Area
Purchase History
| Date | Buyer | Sale Price | Title Company |
|---|---|---|---|
| Patterson Mark Anthony | $115,000 | -- | |
| Williams Tara L | $99,500 | -- | |
| Aycock Glynn T | -- | -- | |
| Aycock Pauline D Mrs | -- | -- |
Source: Public Records
Mortgage History
| Date | Status | Borrower | Loan Amount |
|---|---|---|---|
| Open | Patterson Mark Anthony | $112,891 | |
| Previous Owner | Williams Tara L | $101,529 |
Source: Public Records
Tax History
| Year | Tax Paid | Tax Assessment Tax Assessment Total Assessment is a certain percentage of the fair market value that is determined by local assessors to be the total taxable value of land and additions on the property. | Land | Improvement |
|---|---|---|---|---|
| 2025 | $2,504 | $84,564 | $3,360 | $81,204 |
| 2024 | $2,896 | $79,056 | $3,360 | $75,696 |
| 2023 | $1,621 | $44,943 | $2,409 | $42,534 |
| 2022 | $1,621 | $44,943 | $2,409 | $42,534 |
| 2021 | $1,680 | $44,943 | $2,409 | $42,534 |
| 2020 | $1,680 | $44,943 | $2,409 | $42,534 |
| 2019 | $1,680 | $44,943 | $2,409 | $42,534 |
| 2018 | $1,680 | $44,943 | $2,409 | $42,534 |
| 2017 | $1,245 | $43,114 | $3,766 | $39,348 |
| 2016 | $1,175 | $41,386 | $3,766 | $37,620 |
| 2015 | -- | $41,387 | $3,766 | $37,620 |
| 2014 | -- | $40,190 | $3,766 | $36,424 |
Source: Public Records
Map
Nearby Homes
- 44 E Plum St
- 142 N Tallahassee St
- 95 E Plum St
- 19 Martin Luther King jr Blvd
- 49 N Gill St
- 36 N Cromartie St
- 27 Park Ave
- 73 Latimer St
- 116 Walton Way
- 75 Wilson St
- 44 Kersey St
- 45 Kersey St
- 64 Lakeside Dr
- 45 Elton St
- 182 Rogers St
- 000 Old Graham Rd
- 0 Old Graham Rd Unit 10699984
- 99 Joe Hester Rd
- 63 Reagin Rd
- 10 Grove St
Your Personal Tour Guide
Ask me questions while you tour the home.