48 Edward Dr Pembroke, MA 02359
Estimated Value: $805,332 - $1,053,000
Studio
3
Baths
1,782
Sq Ft
$527/Sq Ft
Est. Value
About This Home
This home is located at 48 Edward Dr, Pembroke, MA 02359 and is currently estimated at $939,083, approximately $526 per square foot. 48 Edward Dr is a home located in Plymouth County with nearby schools including Pembroke High School.
Ownership History
Date
Name
Owned For
Owner Type
Purchase Details
Closed on
Jun 29, 2015
Sold by
Fabian James M and Fabian Karen L
Bought by
Fabian James M
Current Estimated Value
Home Financials for this Owner
Home Financials are based on the most recent Mortgage that was taken out on this home.
Original Mortgage
$319,100
Outstanding Balance
$241,100
Interest Rate
3%
Mortgage Type
Adjustable Rate Mortgage/ARM
Estimated Equity
$697,983
Purchase Details
Closed on
Jun 1, 2000
Sold by
Marvin Rt
Bought by
Fabian James M and Fabian Karen L
Home Financials for this Owner
Home Financials are based on the most recent Mortgage that was taken out on this home.
Original Mortgage
$209,000
Interest Rate
8.14%
Mortgage Type
Purchase Money Mortgage
Create a Home Valuation Report for This Property
The Home Valuation Report is an in-depth analysis detailing your home's value as well as a comparison with similar homes in the area
Purchase History
| Date | Buyer | Sale Price | Title Company |
|---|---|---|---|
| Fabian James M | -- | -- | |
| Fabian James M | $309,900 | -- |
Source: Public Records
Mortgage History
| Date | Status | Borrower | Loan Amount |
|---|---|---|---|
| Open | Fabian James M | $319,100 | |
| Previous Owner | Fabian James M | $260,000 | |
| Previous Owner | Fabian James M | $215,000 | |
| Previous Owner | Fabian James M | $209,000 |
Source: Public Records
Tax History
| Year | Tax Paid | Tax Assessment Tax Assessment Total Assessment is a certain percentage of the fair market value that is determined by local assessors to be the total taxable value of land and additions on the property. | Land | Improvement |
|---|---|---|---|---|
| 2025 | $8,888 | $739,400 | $325,400 | $414,000 |
| 2024 | $8,753 | $727,600 | $320,200 | $407,400 |
| 2023 | $8,288 | $651,600 | $295,400 | $356,200 |
| 2022 | $7,657 | $541,100 | $235,400 | $305,700 |
| 2021 | $7,638 | $523,900 | $230,200 | $293,700 |
| 2020 | $7,515 | $518,600 | $230,200 | $288,400 |
| 2019 | $7,234 | $495,500 | $220,200 | $275,300 |
| 2018 | $7,184 | $482,500 | $220,200 | $262,300 |
| 2017 | $7,034 | $465,800 | $205,400 | $260,400 |
| 2016 | $6,949 | $455,400 | $195,400 | $260,000 |
| 2015 | $6,586 | $446,800 | $185,400 | $261,400 |
Source: Public Records
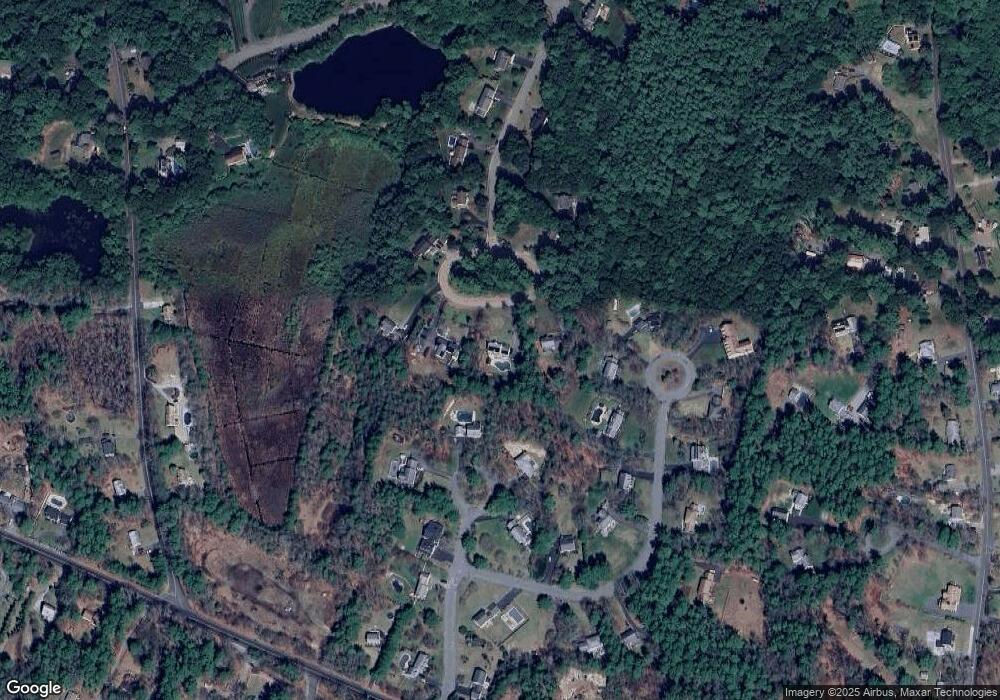
Map
Nearby Homes
- 26 Jessica Cir
- 290 School St
- 10 Mattakeesett Ave
- 100 Valley St
- 131 Elmer St
- 10 Fir Rd
- 59 Erikson Ln
- 64 Copperwood Rd
- 72 Old Cart Path Ln Unit Lot 2
- 78 Old Cart Path Ln Unit Lot 3
- 77 Old Cart Path Ln Unit Lot 4
- 7 Andrew Dr
- 0 Thompson St
- 143 Plymouth St
- 25 Lawrence Rd
- 246 High St
- 14 Baltzer Dr
- 12 Herring Brook Ln
- 66 Wildwood Rd
- 561 Twin Lakes Dr
Your Personal Tour Guide
Ask me questions while you tour the home.