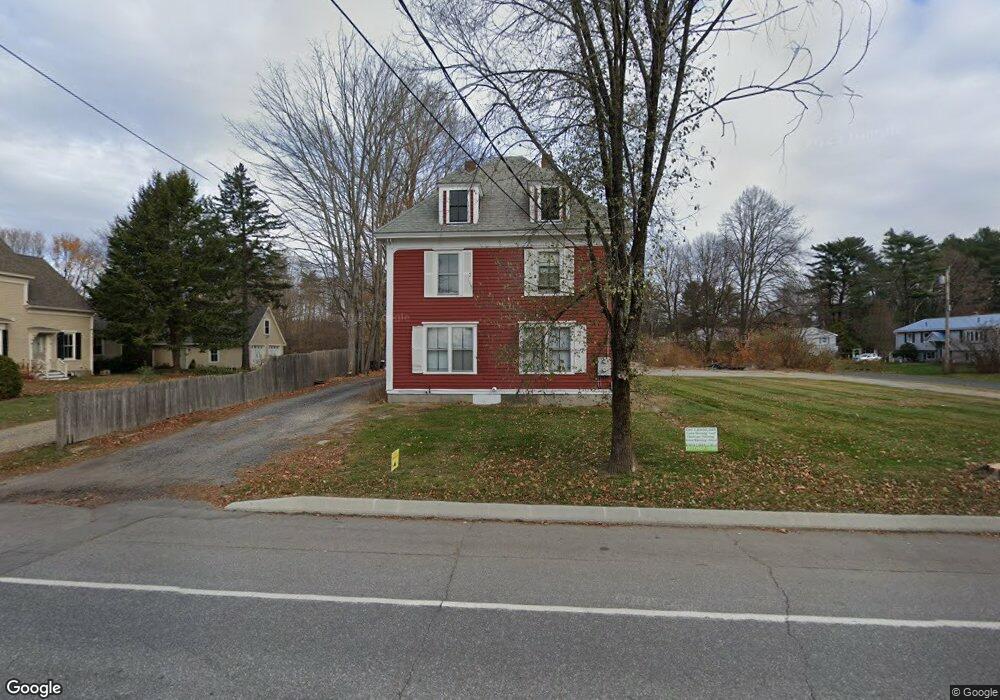
48 Elm St Topsham, ME 04086
Estimated Value: $443,000 - $519,000
3
Beds
3
Baths
3,229
Sq Ft
$150/Sq Ft
Est. Value
About This Home
This home is located at 48 Elm St, Topsham, ME 04086 and is currently estimated at $485,964, approximately $150 per square foot. 48 Elm St is a home located in Sagadahoc County with nearby schools including Mt Ararat High School, Harpswell Coastal Academy Divisions 2 and 3, and St. John's Catholic School.
Ownership History
Date
Name
Owned For
Owner Type
Purchase Details
Closed on
Dec 18, 2020
Sold by
Williams Glenn and Williams Elizabeth H
Bought by
Troisi Jordan K and Dattilo Lauren
Current Estimated Value
Home Financials for this Owner
Home Financials are based on the most recent Mortgage that was taken out on this home.
Original Mortgage
$404,800
Outstanding Balance
$359,562
Interest Rate
2.7%
Mortgage Type
New Conventional
Estimated Equity
$126,402
Purchase Details
Closed on
May 24, 2017
Sold by
Fox Judith A Est
Bought by
Passage Sarah E
Create a Home Valuation Report for This Property
The Home Valuation Report is an in-depth analysis detailing your home's value as well as a comparison with similar homes in the area
Home Values in the Area
Average Home Value in this Area
Purchase History
| Date | Buyer | Sale Price | Title Company |
|---|---|---|---|
| Troisi Jordan K | -- | None Available | |
| Passage Sarah E | -- | -- |
Source: Public Records
Mortgage History
| Date | Status | Borrower | Loan Amount |
|---|---|---|---|
| Open | Troisi Jordan K | $404,800 |
Source: Public Records
Tax History Compared to Growth
Tax History
| Year | Tax Paid | Tax Assessment Tax Assessment Total Assessment is a certain percentage of the fair market value that is determined by local assessors to be the total taxable value of land and additions on the property. | Land | Improvement |
|---|---|---|---|---|
| 2025 | $5,179 | $404,600 | $59,000 | $345,600 |
| 2024 | $5,004 | $400,300 | $54,700 | $345,600 |
| 2023 | $4,790 | $352,700 | $52,200 | $300,500 |
| 2022 | $4,570 | $316,900 | $50,300 | $266,600 |
| 2021 | $4,428 | $279,000 | $46,200 | $232,800 |
| 2020 | $4,579 | $256,400 | $46,200 | $210,200 |
| 2019 | $4,856 | $253,600 | $46,200 | $207,400 |
| 2018 | $4,235 | $226,100 | $41,300 | $184,800 |
| 2017 | $4,706 | $259,700 | $41,300 | $218,400 |
| 2016 | $4,672 | $259,700 | $41,300 | $218,400 |
| 2015 | $4,664 | $259,700 | $41,300 | $218,400 |
| 2014 | $4,383 | $252,900 | $41,300 | $211,600 |
| 2013 | $4,211 | $252,900 | $41,300 | $211,600 |
Source: Public Records
Map
Nearby Homes
- 4 Wilson St
- 86 Merrymeeting Rd
- 118 Main St
- 15 Minat Ave
- 26 Merrymeeting Rd
- 29 Winter St
- 21 Barrows Dr
- 19 Mason St
- 10 Merrymeeting Dr
- 11 Lincoln St
- 57 Winter St
- 55 Somerset Place
- 44 Forest Glen Ln
- 28 Forest Glen Ln
- 43 Forest Glen Ln
- 19 Forest Glen Ln
- 23 Forest Glen Ln
- 2 Jasper Dr
- 35 Bath Rd
- 35.5 Bath Rd