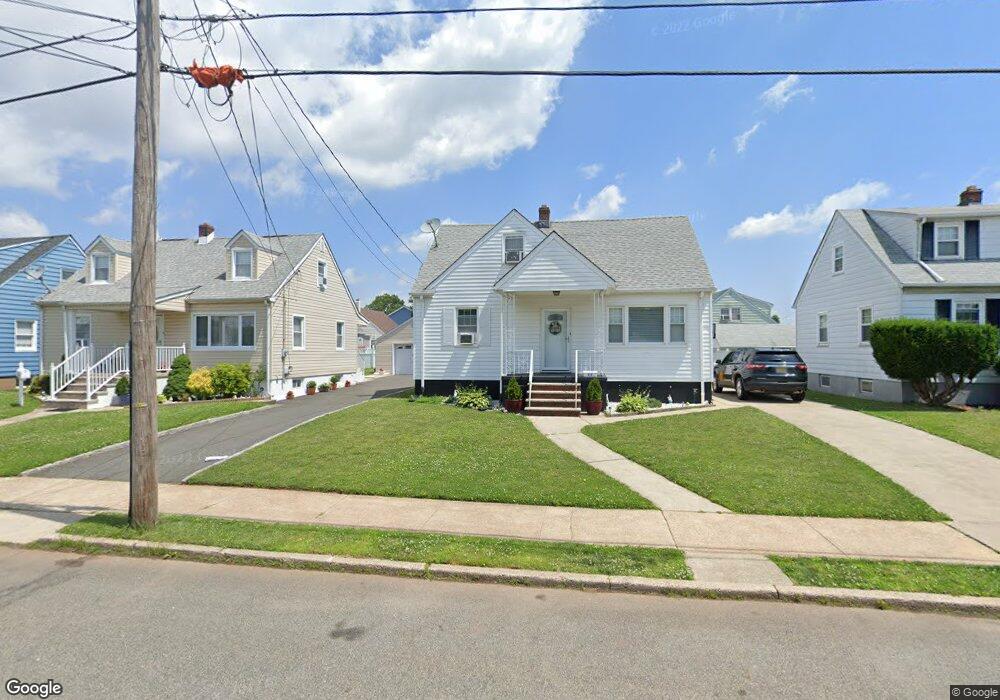
48 Elmwood Ave Carteret, NJ 07008
Estimated Value: $387,516 - $626,000
2
Beds
1
Bath
768
Sq Ft
$630/Sq Ft
Est. Value
About This Home
This home is located at 48 Elmwood Ave, Carteret, NJ 07008 and is currently estimated at $483,879, approximately $630 per square foot. 48 Elmwood Ave is a home located in Middlesex County with nearby schools including Carteret High School and St Joseph School.
Ownership History
Date
Name
Owned For
Owner Type
Purchase Details
Closed on
Aug 7, 2014
Sold by
S Bakes Llc
Bought by
Osorio Sandra and Vazquez Domingo
Current Estimated Value
Home Financials for this Owner
Home Financials are based on the most recent Mortgage that was taken out on this home.
Original Mortgage
$184,500
Outstanding Balance
$140,838
Interest Rate
4.14%
Mortgage Type
New Conventional
Estimated Equity
$343,041
Purchase Details
Closed on
Mar 21, 2014
Sold by
Shallow Edmund
Bought by
S Bakes Llc
Purchase Details
Closed on
Mar 25, 2011
Sold by
Hamorski Ronald
Bought by
Hamorski Ronald
Create a Home Valuation Report for This Property
The Home Valuation Report is an in-depth analysis detailing your home's value as well as a comparison with similar homes in the area
Home Values in the Area
Average Home Value in this Area
Purchase History
| Date | Buyer | Sale Price | Title Company |
|---|---|---|---|
| Osorio Sandra | $205,000 | River Edge Title Agency Llc | |
| S Bakes Llc | $125,000 | None Available | |
| Hamorski Ronald | -- | None Available |
Source: Public Records
Mortgage History
| Date | Status | Borrower | Loan Amount |
|---|---|---|---|
| Open | Osorio Sandra | $184,500 |
Source: Public Records
Tax History Compared to Growth
Tax History
| Year | Tax Paid | Tax Assessment Tax Assessment Total Assessment is a certain percentage of the fair market value that is determined by local assessors to be the total taxable value of land and additions on the property. | Land | Improvement |
|---|---|---|---|---|
| 2025 | $6,067 | $429,000 | $330,000 | $99,000 |
| 2024 | $5,911 | $190,300 | $120,000 | $70,300 |
| 2023 | $5,911 | $190,300 | $120,000 | $70,300 |
| 2022 | $5,747 | $190,300 | $120,000 | $70,300 |
| 2021 | $5,540 | $190,300 | $120,000 | $70,300 |
| 2020 | $5,473 | $190,300 | $120,000 | $70,300 |
| 2019 | $5,315 | $190,300 | $120,000 | $70,300 |
| 2018 | $5,189 | $190,300 | $120,000 | $70,300 |
| 2017 | $5,005 | $190,300 | $120,000 | $70,300 |
| 2016 | $4,814 | $152,000 | $90,000 | $62,000 |
| 2015 | $4,744 | $152,000 | $90,000 | $62,000 |
| 2014 | $4,537 | $152,000 | $90,000 | $62,000 |
Source: Public Records
Map
Nearby Homes