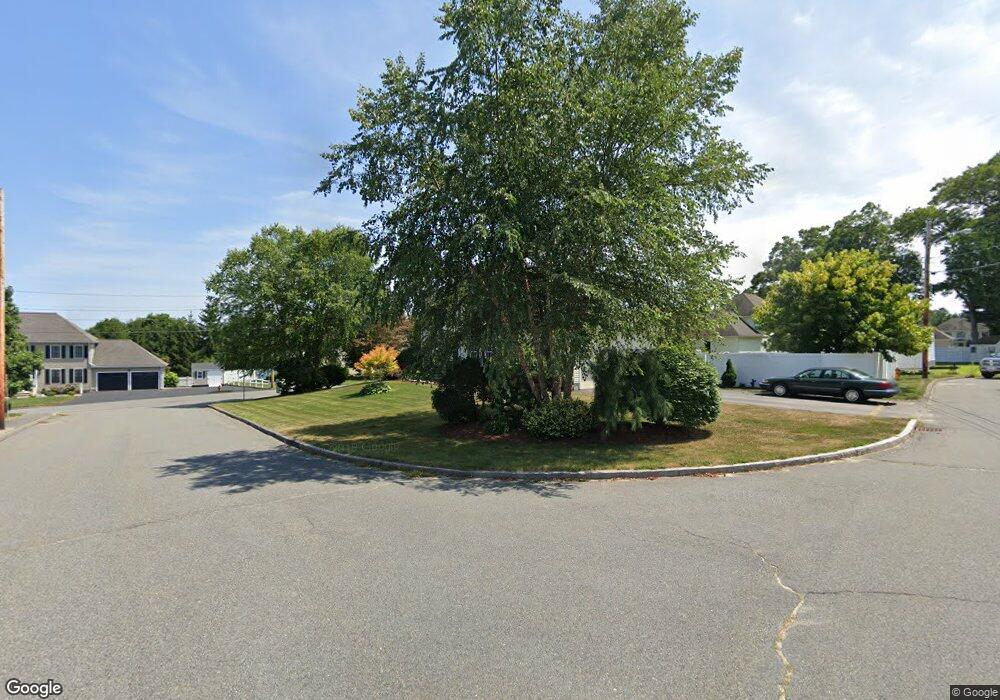
48 Emerald Ln Attleboro, MA 02703
Estimated Value: $596,000 - $739,000
3
Beds
3
Baths
1,728
Sq Ft
$390/Sq Ft
Est. Value
About This Home
This home is located at 48 Emerald Ln, Attleboro, MA 02703 and is currently estimated at $674,512, approximately $390 per square foot. 48 Emerald Ln is a home located in Bristol County with nearby schools including Hill-Roberts Elementary School, Robert J. Coelho Middle School, and Attleboro High School.
Ownership History
Date
Name
Owned For
Owner Type
Purchase Details
Closed on
Nov 18, 1999
Sold by
J C Bldrs Inc
Bought by
Hoyos Juan D and Hoyos Audrey A
Current Estimated Value
Home Financials for this Owner
Home Financials are based on the most recent Mortgage that was taken out on this home.
Original Mortgage
$192,490
Interest Rate
7.76%
Mortgage Type
Purchase Money Mortgage
Create a Home Valuation Report for This Property
The Home Valuation Report is an in-depth analysis detailing your home's value as well as a comparison with similar homes in the area
Home Values in the Area
Average Home Value in this Area
Purchase History
| Date | Buyer | Sale Price | Title Company |
|---|---|---|---|
| Hoyos Juan D | $240,621 | -- |
Source: Public Records
Mortgage History
| Date | Status | Borrower | Loan Amount |
|---|---|---|---|
| Open | Hoyos Juan D | $226,000 | |
| Closed | Hoyos Juan D | $226,400 | |
| Closed | Hoyos Juan D | $192,490 |
Source: Public Records
Tax History
| Year | Tax Paid | Tax Assessment Tax Assessment Total Assessment is a certain percentage of the fair market value that is determined by local assessors to be the total taxable value of land and additions on the property. | Land | Improvement |
|---|---|---|---|---|
| 2025 | $7,102 | $565,900 | $180,100 | $385,800 |
| 2024 | $7,158 | $562,300 | $198,200 | $364,100 |
| 2023 | $6,445 | $470,800 | $173,900 | $296,900 |
| 2022 | $6,004 | $415,500 | $153,500 | $262,000 |
| 2021 | $5,975 | $403,700 | $147,800 | $255,900 |
| 2020 | $5,678 | $390,000 | $140,300 | $249,700 |
| 2019 | $5,527 | $390,300 | $137,700 | $252,600 |
| 2018 | $5,344 | $360,600 | $133,600 | $227,000 |
| 2017 | $5,330 | $366,300 | $139,100 | $227,200 |
| 2016 | $5,151 | $347,600 | $130,000 | $217,600 |
| 2015 | $5,006 | $340,300 | $130,000 | $210,300 |
| 2014 | $4,938 | $332,500 | $125,000 | $207,500 |
Source: Public Records
Map
Nearby Homes
Your Personal Tour Guide
Ask me questions while you tour the home.