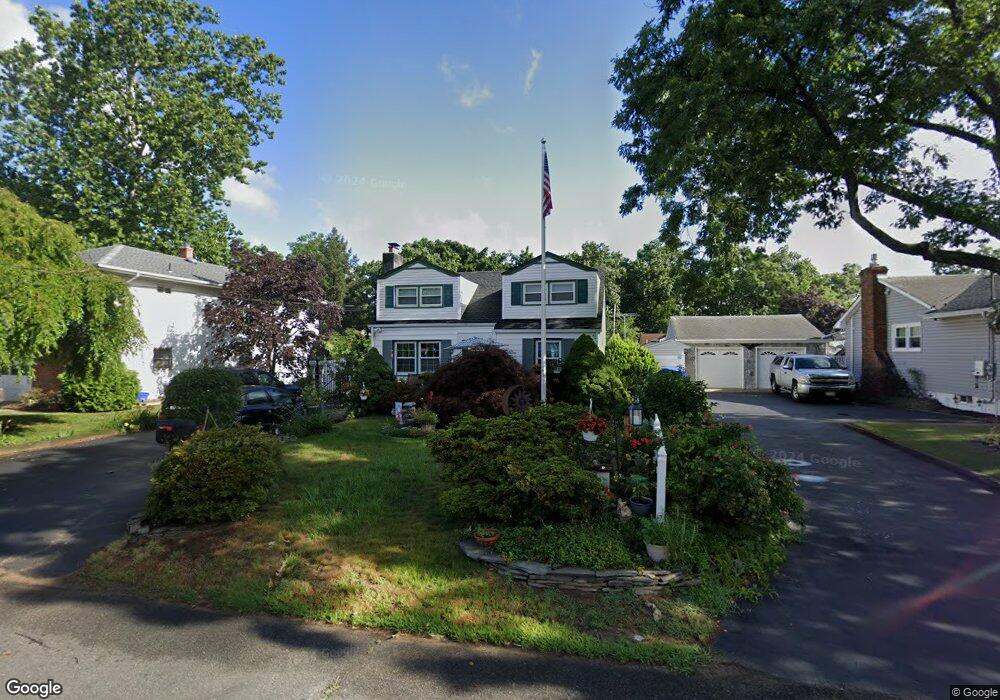
48 Farless Ave Old Bridge, NJ 08857
Estimated Value: $369,160 - $492,000
Studio
--
Bath
1,062
Sq Ft
$428/Sq Ft
Est. Value
About This Home
This home is located at 48 Farless Ave, Old Bridge, NJ 08857 and is currently estimated at $455,040, approximately $428 per square foot. 48 Farless Ave is a home located in Middlesex County with nearby schools including Old Bridge High School and St. Thomas the Apostle School.
Ownership History
Date
Name
Owned For
Owner Type
Purchase Details
Closed on
Nov 29, 1999
Sold by
Hud
Bought by
Cevasco Michael and Cevasco Karin
Current Estimated Value
Home Financials for this Owner
Home Financials are based on the most recent Mortgage that was taken out on this home.
Original Mortgage
$115,000
Outstanding Balance
$35,647
Interest Rate
7.73%
Estimated Equity
$419,393
Purchase Details
Closed on
Aug 2, 1994
Sold by
Viner Selma
Bought by
Wojcik Timothy and Wojcik Mary
Home Financials for this Owner
Home Financials are based on the most recent Mortgage that was taken out on this home.
Original Mortgage
$113,000
Interest Rate
8.4%
Create a Home Valuation Report for This Property
The Home Valuation Report is an in-depth analysis detailing your home's value as well as a comparison with similar homes in the area
Home Values in the Area
Average Home Value in this Area
Purchase History
| Date | Buyer | Sale Price | Title Company |
|---|---|---|---|
| Cevasco Michael | $122,451 | -- | |
| Wojcik Timothy | $114,000 | -- |
Source: Public Records
Mortgage History
| Date | Status | Borrower | Loan Amount |
|---|---|---|---|
| Open | Cevasco Michael | $115,000 | |
| Previous Owner | Wojcik Timothy | $113,000 |
Source: Public Records
Tax History
| Year | Tax Paid | Tax Assessment Tax Assessment Total Assessment is a certain percentage of the fair market value that is determined by local assessors to be the total taxable value of land and additions on the property. | Land | Improvement |
|---|---|---|---|---|
| 2025 | $6,246 | $110,600 | $44,200 | $66,400 |
| 2024 | $5,991 | $110,600 | $44,200 | $66,400 |
| 2023 | $5,991 | $110,600 | $44,200 | $66,400 |
| 2022 | $5,854 | $110,600 | $44,200 | $66,400 |
| 2021 | $4,297 | $110,600 | $44,200 | $66,400 |
| 2020 | $5,682 | $110,600 | $44,200 | $66,400 |
| 2019 | $5,585 | $110,600 | $44,200 | $66,400 |
| 2018 | $5,523 | $110,600 | $44,200 | $66,400 |
| 2017 | $5,344 | $110,600 | $44,200 | $66,400 |
| 2016 | $5,234 | $110,600 | $44,200 | $66,400 |
| 2015 | $5,143 | $110,600 | $44,200 | $66,400 |
| 2014 | $5,091 | $110,600 | $44,200 | $66,400 |
Source: Public Records
Map
Nearby Homes
- 24 Kensington Ave
- 931 Englishtown Rd
- 21 Fourth St
- 110 Charles St
- 1210 Englishtown Rd
- 98 Madison Ave
- 23 Orchard Dr
- 2 Michael Ct
- 30 Arvin Rd
- 34 Brookside Ave
- 21 Pine St
- 14 Andover Rd
- 132 Southwood Dr
- 18 Andover Rd
- 14 Brookside Ave
- 9 Diamond Ct
- 1283 Englishtown Rd
- 27 Harrison Ave
- 45 Piersoll Rd
- 1299 Englishtown Rd
Your Personal Tour Guide
Ask me questions while you tour the home.