
Seller's Agent in 2023
Jim Osmundsen
Donnelly + Co.
(914) 924-8202
2 in this area
6 Total Sales


Estimated Value: $4,001,000 - $6,200,111
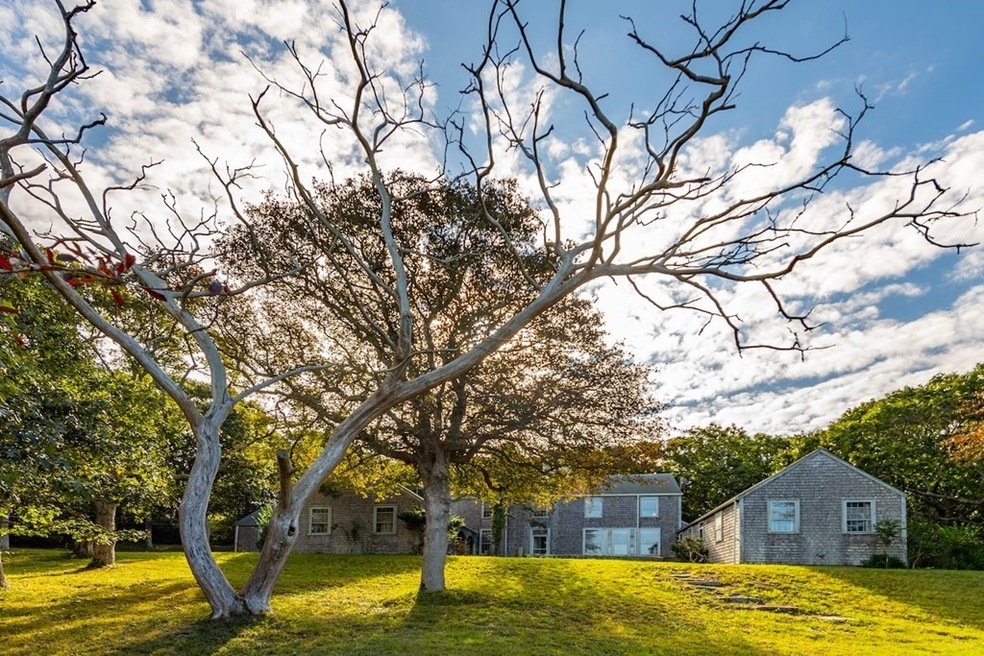
Waterfront in Seven Gates Farm and rare opportunities are synonyms. This coveted community offers nearly 2,000 acres of the Island's most beautiful, dramatic conservation land including two miles of walkable beach, two docks, two tennis courts and extensive trails. This waterfront home, an originally circa 1932 build was purposely aimed for sentimental reasons toward Tarpaulin Cove. Some of the lumber used for the build was reportedly sailed to the site from Maine, possibly because the owners family summered in N.E. Harbor, Maine. The u-shaped dwelling with inner courtyard provides inviting picturesque views of a lower pond and Vineyard Sound the eight bedroom, four bathroom 4,800 square foot home is nestled into a gentle slope of this 6.1 acre parcel.The family matriarch purchased the home in 1955 and then in 1956 winterized, modernized the interior and had a garage built. This long standing home with history is eagerly awaiting a new owner to begin this home's next chapter
| Date | Event | Price | List to Sale | Price per Sq Ft |
|---|---|---|---|---|
| 03/09/2023 03/09/23 | Sold | $5,500,000 | -19.1% | $1,146 / Sq Ft |
| 02/10/2023 02/10/23 | Pending | -- | -- | -- |
| 10/03/2022 10/03/22 | Price Changed | $6,800,000 | -9.3% | $1,417 / Sq Ft |
| 06/10/2022 06/10/22 | Price Changed | $7,500,000 | -11.8% | $1,563 / Sq Ft |
| 11/20/2021 11/20/21 | For Sale | $8,500,000 | -- | $1,771 / Sq Ft |
| Year | Tax Paid | Tax Assessment Tax Assessment Total Assessment is a certain percentage of the fair market value that is determined by local assessors to be the total taxable value of land and additions on the property. | Land | Improvement |
|---|---|---|---|---|
| 2025 | $33,810 | $7,463,500 | $6,944,600 | $518,900 |
| 2024 | $31,111 | $7,235,200 | $6,743,200 | $492,000 |
| 2023 | $37,860 | $8,683,400 | $8,048,300 | $635,100 |
| 2022 | $33,805 | $5,808,400 | $5,389,600 | $418,800 |
| 2021 | $27,839 | $4,563,700 | $4,175,300 | $388,400 |
| 2020 | $34,273 | $4,563,700 | $4,175,300 | $388,400 |
| 2019 | $9,636 | $4,529,500 | $4,175,300 | $354,200 |
| 2018 | $26,586 | $4,387,200 | $4,042,500 | $344,700 |
| 2017 | $9,182 | $4,457,600 | $4,131,800 | $325,800 |
| 2016 | $25,533 | $4,213,400 | $3,926,000 | $287,400 |
| 2015 | $24,059 | $4,213,400 | $3,926,000 | $287,400 |
| 2014 | $27,161 | $5,020,500 | $4,827,200 | $193,300 |
Seller's Agent in 2023
Jim Osmundsen
Donnelly + Co.
(914) 924-8202
2 in this area
6 Total Sales
Buyer's Agent in 2023
Jarrett Hurwitz
Keller Williams Realty
(845) 596-6740
2 in this area
53 Total Sales
Source: MLS Property Information Network (MLS PIN)
MLS Number: 72922127
APN: WTIS-000013-000002
Disclaimer: Certain information contained herein is derived from information provided by parties other than Homes.com. All information provided is deemed reliable, but is not guaranteed to be accurate and should be independently verified.
![]() The property listing data and information, or the Images, set forth herein were provided to MLS Property Information Network, Inc. from third party sources, including sellers, lessors and public records, and were compiled by MLS Property Information Network, Inc. The property listing data and information, and the Images, are for the personal, non-commercial use of consumers having a good faith interest in purchasing or leasing listed properties of the type displayed to them and may not be used for any purpose other than to identify prospective properties which such consumers may have a good faith interest in purchasing or leasing. MLS Property Information Network, Inc. and its subscribers disclaim any and all representations and warranties as to the accuracy of the property listing data and information, or as to the accuracy of any of the Images, set forth herein.
The property listing data and information, or the Images, set forth herein were provided to MLS Property Information Network, Inc. from third party sources, including sellers, lessors and public records, and were compiled by MLS Property Information Network, Inc. The property listing data and information, and the Images, are for the personal, non-commercial use of consumers having a good faith interest in purchasing or leasing listed properties of the type displayed to them and may not be used for any purpose other than to identify prospective properties which such consumers may have a good faith interest in purchasing or leasing. MLS Property Information Network, Inc. and its subscribers disclaim any and all representations and warranties as to the accuracy of the property listing data and information, or as to the accuracy of any of the Images, set forth herein.
Ask me questions while you tour the home.