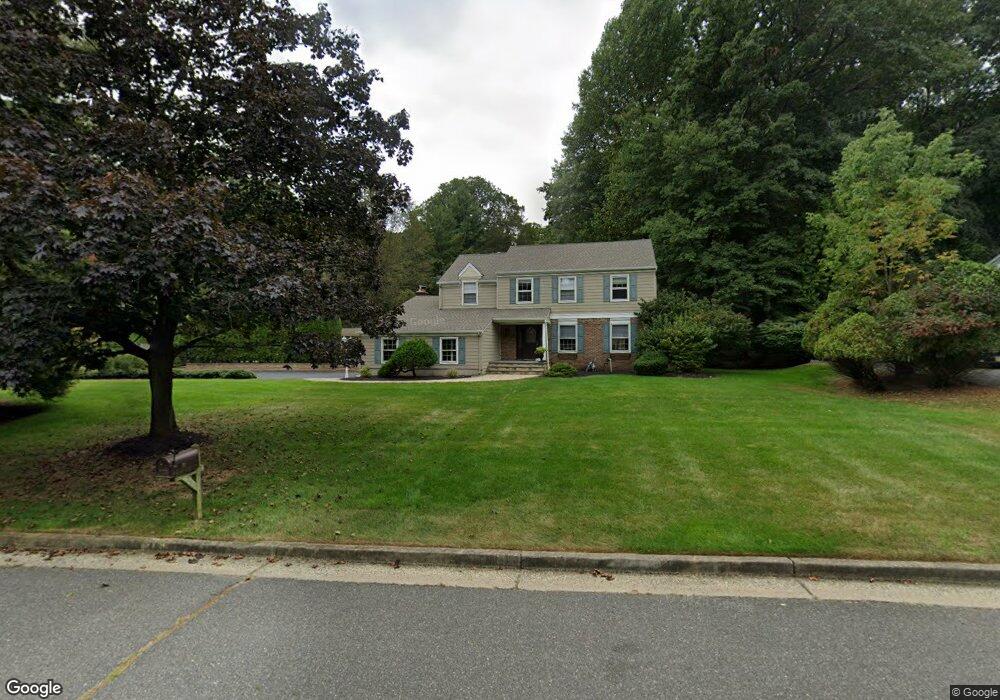
48 Foxwood Run Middletown, NJ 07748
New Monmouth NeighborhoodEstimated Value: $1,106,000 - $1,154,000
4
Beds
3
Baths
2,652
Sq Ft
$427/Sq Ft
Est. Value
About This Home
This home is located at 48 Foxwood Run, Middletown, NJ 07748 and is currently estimated at $1,133,176, approximately $427 per square foot. 48 Foxwood Run is a home located in Monmouth County with nearby schools including Middletown Village Elementary School, Thompson Middle School, and Middletown High School North.
Ownership History
Date
Name
Owned For
Owner Type
Purchase Details
Closed on
Jun 24, 1996
Sold by
Klotz Frank
Bought by
Annunziata Steven and Annunziata Christine
Current Estimated Value
Home Financials for this Owner
Home Financials are based on the most recent Mortgage that was taken out on this home.
Original Mortgage
$250,000
Outstanding Balance
$15,944
Interest Rate
7.98%
Estimated Equity
$1,117,232
Create a Home Valuation Report for This Property
The Home Valuation Report is an in-depth analysis detailing your home's value as well as a comparison with similar homes in the area
Home Values in the Area
Average Home Value in this Area
Purchase History
| Date | Buyer | Sale Price | Title Company |
|---|---|---|---|
| Annunziata Steven | $266,000 | -- |
Source: Public Records
Mortgage History
| Date | Status | Borrower | Loan Amount |
|---|---|---|---|
| Open | Annunziata Steven | $250,000 |
Source: Public Records
Tax History Compared to Growth
Tax History
| Year | Tax Paid | Tax Assessment Tax Assessment Total Assessment is a certain percentage of the fair market value that is determined by local assessors to be the total taxable value of land and additions on the property. | Land | Improvement |
|---|---|---|---|---|
| 2025 | $15,019 | $962,000 | $434,900 | $527,100 |
| 2024 | $15,086 | $913,000 | $395,600 | $517,400 |
| 2023 | $15,086 | $868,000 | $374,500 | $493,500 |
| 2022 | $14,593 | $770,500 | $300,600 | $469,900 |
| 2021 | $14,593 | $701,600 | $278,300 | $423,300 |
| 2020 | $14,498 | $678,100 | $264,400 | $413,700 |
| 2019 | $14,248 | $674,600 | $258,300 | $416,300 |
| 2018 | $13,984 | $645,300 | $248,300 | $397,000 |
| 2017 | $13,549 | $637,900 | $248,300 | $389,600 |
| 2016 | $13,225 | $620,600 | $273,300 | $347,300 |
| 2015 | $12,931 | $605,400 | $253,300 | $352,100 |
| 2014 | $12,370 | $565,100 | $243,300 | $321,800 |
Source: Public Records
Map
Nearby Homes
- 93 Wallace Rd
- 8 Church St
- 74 Fish Hawk Dr
- 164 Heights Terrace
- 17 Winding Brook Way
- 78 Ironwood Ct
- 20 Cormorant Dr
- 7 Cormorant Dr
- 93 Twin Brooks Ave
- 4 Takolusa Dr
- 3 Green Oak Blvd
- 45 Galloping Hill Cir
- 234 Borden Rd
- 30 Winchester Ln
- 33 Winchester Ln
- 20 Devon Rd
- 161 Cherry Tree Ln
- 237 Grand Cypress Ct Unit N328
- 237 Grand Cypress Ct
- 83 Green Meadow Blvd