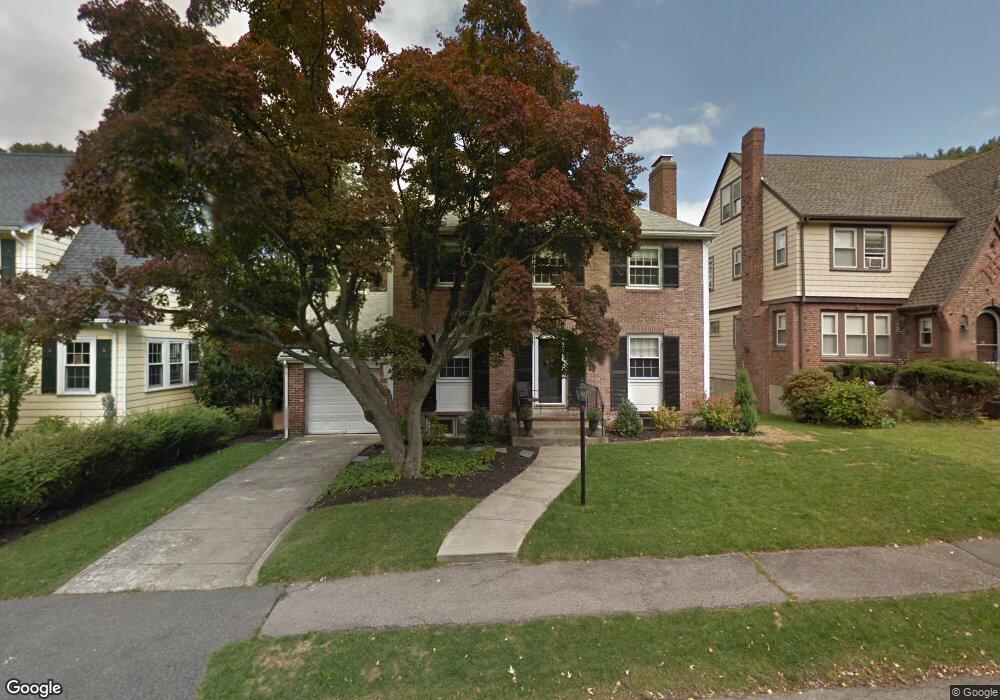
48 Frothingham St Milton, MA 02186
Milton Center NeighborhoodEstimated Value: $997,000 - $1,279,000
3
Beds
2
Baths
2,093
Sq Ft
$558/Sq Ft
Est. Value
About This Home
This home is located at 48 Frothingham St, Milton, MA 02186 and is currently estimated at $1,167,405, approximately $557 per square foot. 48 Frothingham St is a home located in Norfolk County with nearby schools including Milton High School, St. Mary of the Hills School, and Milton Academy.
Ownership History
Date
Name
Owned For
Owner Type
Purchase Details
Closed on
Aug 1, 2011
Sold by
Mclean Dorothy M Est
Bought by
Hunt Peter C and Hunt Holly L
Current Estimated Value
Home Financials for this Owner
Home Financials are based on the most recent Mortgage that was taken out on this home.
Original Mortgage
$417,000
Outstanding Balance
$280,937
Interest Rate
4%
Mortgage Type
Purchase Money Mortgage
Estimated Equity
$886,468
Create a Home Valuation Report for This Property
The Home Valuation Report is an in-depth analysis detailing your home's value as well as a comparison with similar homes in the area
Home Values in the Area
Average Home Value in this Area
Purchase History
| Date | Buyer | Sale Price | Title Company |
|---|---|---|---|
| Hunt Peter C | $532,000 | -- |
Source: Public Records
Mortgage History
| Date | Status | Borrower | Loan Amount |
|---|---|---|---|
| Open | Hunt Peter C | $417,000 |
Source: Public Records
Tax History Compared to Growth
Tax History
| Year | Tax Paid | Tax Assessment Tax Assessment Total Assessment is a certain percentage of the fair market value that is determined by local assessors to be the total taxable value of land and additions on the property. | Land | Improvement |
|---|---|---|---|---|
| 2025 | $11,051 | $996,500 | $561,100 | $435,400 |
| 2024 | $10,591 | $969,900 | $534,500 | $435,400 |
| 2023 | $10,397 | $912,000 | $509,000 | $403,000 |
| 2022 | $10,257 | $822,500 | $509,000 | $313,500 |
| 2021 | $9,777 | $744,600 | $446,100 | $298,500 |
| 2020 | $9,634 | $734,300 | $441,900 | $292,400 |
| 2019 | $9,395 | $712,800 | $429,000 | $283,800 |
| 2018 | $8,541 | $618,500 | $339,300 | $279,200 |
| 2017 | $7,994 | $589,500 | $323,100 | $266,400 |
| 2016 | $8,243 | $610,600 | $350,000 | $260,600 |
| 2015 | $7,680 | $550,900 | $301,600 | $249,300 |
Source: Public Records
Map
Nearby Homes
- 19 Lantern Ln
- 390 Central Ave
- 438 Central Ave Unit 2
- 290 Central Ave
- 20 Herrick Dr
- 54 Elm St
- 137 Thacher St Unit 137
- 96 Houston Ave
- 1 Chilton Park
- 32 Columbine Rd
- 651 Canton Ave
- 70 Warren Ave
- 214 Brook Rd
- 15 Fairfax Rd
- 795 Brook Rd
- 333 Eliot St
- 10 Weston St
- 4 School St
- 27 Hawthorn Rd
- 128 Blue Hills Pkwy
- 50 Frothingham St
- 46 Frothingham St
- 54 Frothingham St
- 21 Cape Cod Ln
- 25 Cape Cod Ln
- 39 Frothingham St
- 37 Frothingham St
- 17 Cape Cod Ln
- 58 Frothingham St
- 41 Frothingham St
- 31 Cape Cod Ln
- 35 Frothingham St
- 32 Frothingham St
- 64 Frothingham St
- 15 Cape Cod Ln
- 20 Lantern Ln
- 16 Lantern Ln
- 31 Frothingham St
- 26 Frothingham St
- 37 Cape Cod Ln