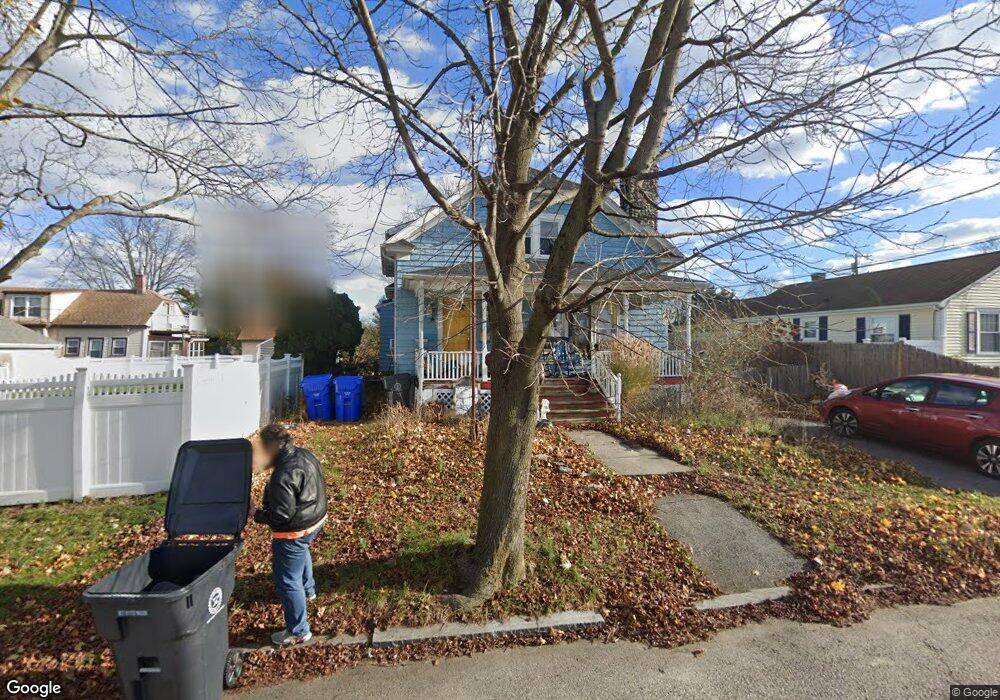
48 Gerald St Riverside, RI 02915
Outer East Bay NeighborhoodEstimated Value: $486,806 - $534,000
4
Beds
2
Baths
1,927
Sq Ft
$267/Sq Ft
Est. Value
About This Home
This home is located at 48 Gerald St, Riverside, RI 02915 and is currently estimated at $513,952, approximately $266 per square foot. 48 Gerald St is a home located in Providence County with nearby schools including East Providence High School, The Gordon School, and St Mary Academy-Bay View.
Ownership History
Date
Name
Owned For
Owner Type
Purchase Details
Closed on
Mar 1, 2006
Sold by
Crosslin John and Crosslin Helena
Bought by
Powers Stuart T
Current Estimated Value
Home Financials for this Owner
Home Financials are based on the most recent Mortgage that was taken out on this home.
Original Mortgage
$73,080
Interest Rate
6.16%
Mortgage Type
Purchase Money Mortgage
Create a Home Valuation Report for This Property
The Home Valuation Report is an in-depth analysis detailing your home's value as well as a comparison with similar homes in the area
Home Values in the Area
Average Home Value in this Area
Purchase History
| Date | Buyer | Sale Price | Title Company |
|---|---|---|---|
| Powers Stuart T | $90,000 | -- | |
| Powers Stuart T | $90,000 | -- |
Source: Public Records
Mortgage History
| Date | Status | Borrower | Loan Amount |
|---|---|---|---|
| Open | Powers Stuart T | $20,000 | |
| Open | Powers Stuart T | $101,000 | |
| Closed | Powers Stuart T | $73,080 |
Source: Public Records
Tax History
| Year | Tax Paid | Tax Assessment Tax Assessment Total Assessment is a certain percentage of the fair market value that is determined by local assessors to be the total taxable value of land and additions on the property. | Land | Improvement |
|---|---|---|---|---|
| 2025 | $6,181 | $472,900 | $109,900 | $363,000 |
| 2024 | $4,952 | $323,000 | $91,600 | $231,400 |
| 2023 | $4,767 | $323,000 | $91,600 | $231,400 |
| 2022 | $4,505 | $206,100 | $56,200 | $149,900 |
| 2021 | $4,431 | $206,100 | $54,400 | $151,700 |
| 2020 | $4,244 | $206,100 | $54,400 | $151,700 |
| 2019 | $4,126 | $206,100 | $54,400 | $151,700 |
| 2018 | $3,956 | $172,900 | $47,600 | $125,300 |
| 2017 | $3,868 | $172,900 | $47,600 | $125,300 |
| 2016 | $3,849 | $172,900 | $47,600 | $125,300 |
| 2015 | $3,826 | $166,700 | $48,900 | $117,800 |
| 2014 | $3,826 | $166,700 | $48,900 | $117,800 |
Source: Public Records
Map
Nearby Homes
- 42 Mountain Ave
- 53 Wampanoag Trail
- 2941 Pawtucket Ave
- 180 Grassmere Ave
- 34 Commack Rd
- 14 Maxfield Ave
- 72 Allerton Ave
- 74 Brookhaven Dr
- 177 Dover Ave
- 77 Gardiner Ave
- 151 Dover Ave
- 378 Juniper St
- 25 Ingraham St
- 41 Follett St
- 210 N County St
- 58 Swan St
- 6 Fuller Ave
- 170 Schuyler St
- 157 Grosvenor Ave
- 25 Bullocks Point Ave Unit 5C
Your Personal Tour Guide
Ask me questions while you tour the home.