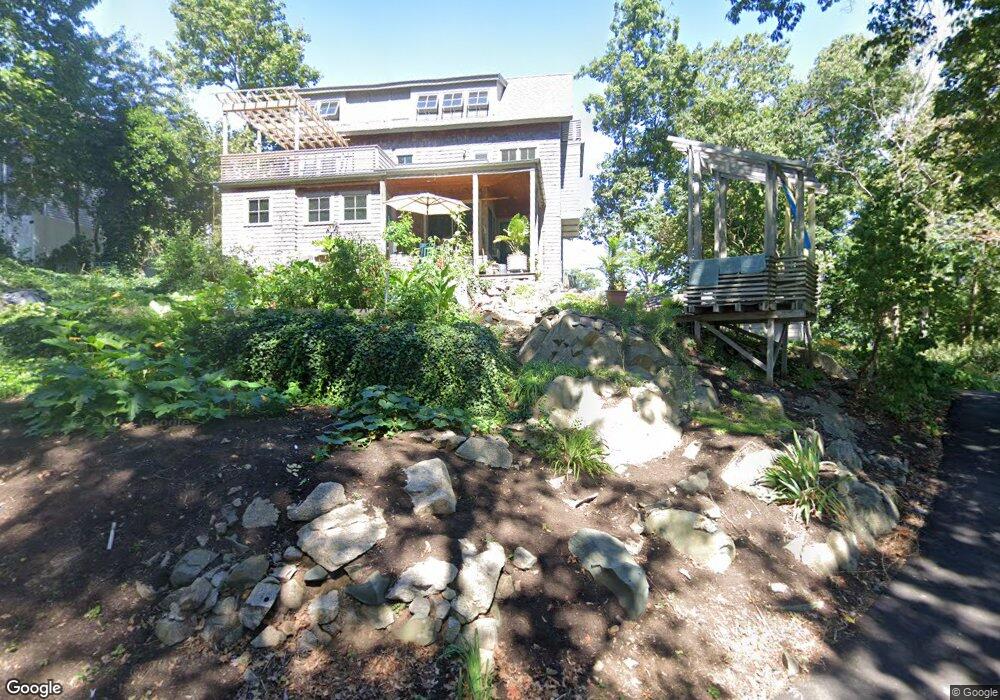
48 Gilford Rd Hingham, MA 02043
Estimated Value: $1,037,756 - $2,089,000
2
Beds
4
Baths
2,611
Sq Ft
$549/Sq Ft
Est. Value
About This Home
This home is located at 48 Gilford Rd, Hingham, MA 02043 and is currently estimated at $1,434,189, approximately $549 per square foot. 48 Gilford Rd is a home located in Plymouth County with nearby schools including East Elementary School, Hingham Middle School, and Hingham High School.
Ownership History
Date
Name
Owned For
Owner Type
Purchase Details
Closed on
Sep 1, 1994
Sold by
Weir River T and Toth Cynthia E
Bought by
Mcmichael Jay M and Ogrady Julia
Current Estimated Value
Purchase Details
Closed on
Mar 24, 1989
Sold by
Hickie William W
Bought by
Totp Clynthia E
Purchase Details
Closed on
Mar 22, 1989
Sold by
Hickie William W
Bought by
Toth Cynthia E
Create a Home Valuation Report for This Property
The Home Valuation Report is an in-depth analysis detailing your home's value as well as a comparison with similar homes in the area
Purchase History
| Date | Buyer | Sale Price | Title Company |
|---|---|---|---|
| Mcmichael Jay M | $130,000 | -- | |
| Mcmichael Jay M | $130,000 | -- | |
| Totp Clynthia E | $105,000 | -- | |
| Totp Clynthia E | $105,000 | -- | |
| Toth Cynthia E | $105,000 | -- | |
| Toth Cynthia E | $105,000 | -- |
Source: Public Records
Mortgage History
| Date | Status | Borrower | Loan Amount |
|---|---|---|---|
| Open | Toth Cynthia E | $198,000 | |
| Closed | Toth Cynthia E | $200,000 |
Source: Public Records
Tax History Compared to Growth
Tax History
| Year | Tax Paid | Tax Assessment Tax Assessment Total Assessment is a certain percentage of the fair market value that is determined by local assessors to be the total taxable value of land and additions on the property. | Land | Improvement |
|---|---|---|---|---|
| 2025 | $8,810 | $824,100 | $393,600 | $430,500 |
| 2024 | $8,736 | $805,200 | $393,600 | $411,600 |
| 2023 | $7,627 | $762,700 | $393,600 | $369,100 |
| 2022 | $7,261 | $628,100 | $339,600 | $288,500 |
| 2021 | $6,989 | $592,300 | $339,600 | $252,700 |
| 2020 | $6,829 | $592,300 | $339,600 | $252,700 |
| 2019 | $6,995 | $592,300 | $339,600 | $252,700 |
| 2018 | $6,915 | $587,500 | $339,600 | $247,900 |
| 2017 | $6,180 | $504,500 | $262,200 | $242,300 |
| 2016 | $6,312 | $505,400 | $249,700 | $255,700 |
| 2015 | $6,879 | $549,000 | $198,800 | $350,200 |
Source: Public Records
Map
Nearby Homes
- 44 Gilford Rd
- 112 Martins Ln
- 8 Evergreen Ln
- 10R Martins Ln
- 101 Rockland St
- 155 George Washington Blvd Unit 402
- 1 Rockland St
- LOT 1B Rockland St
- 8 Hampton Cir
- 134 Hampton Cir
- 9 Barnes Rd
- 127 Hampton Cir
- 23 Wyola Rd
- 22 Berkley Rd Unit B
- 3 3rd St
- 4 Atherton Rd
- 121 Nantasket Ave Unit 503
- 114 Hull St
- 107 Hull St
- 166 Hull St