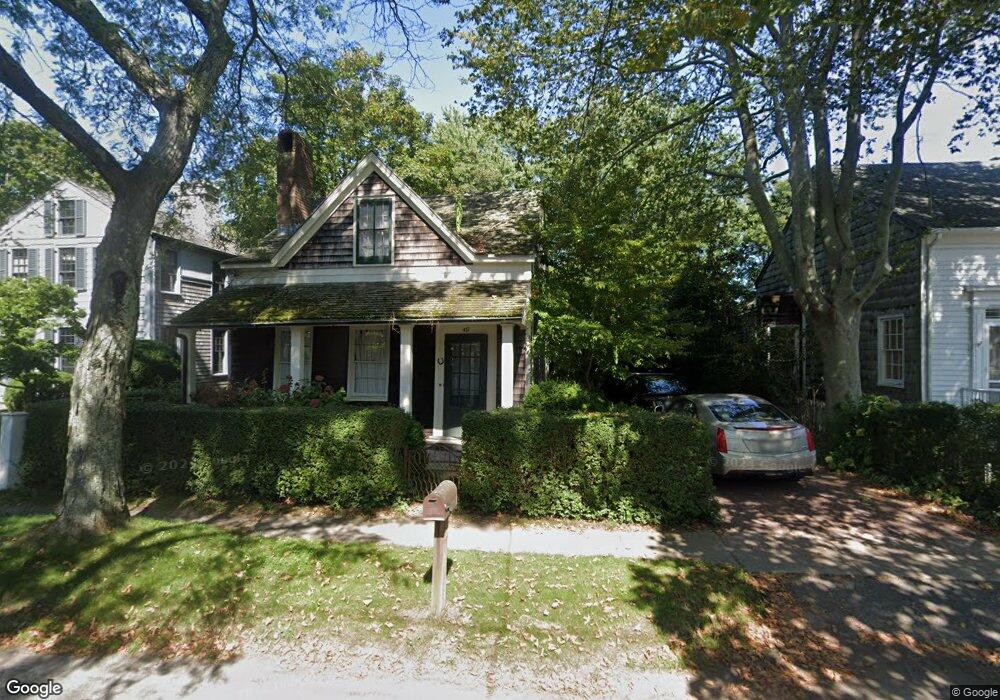
48 Glover St Sag Harbor, NY 11963
Estimated Value: $1,844,000 - $3,229,054
2
Beds
1
Bath
1,349
Sq Ft
$1,849/Sq Ft
Est. Value
About This Home
This home is located at 48 Glover St, Sag Harbor, NY 11963 and is currently estimated at $2,494,264, approximately $1,848 per square foot. 48 Glover St is a home located in Suffolk County with nearby schools including Sag Harbor Elementary School, Pierson Middle/High School, and Ross Lower School.
Ownership History
Date
Name
Owned For
Owner Type
Purchase Details
Closed on
Feb 26, 2008
Sold by
Sheedy Charlotte
Bought by
Sibeud Eugenie B
Current Estimated Value
Purchase Details
Closed on
Feb 14, 2008
Sold by
Sheedy Charlotte
Bought by
Sibeud Eugenie B
Purchase Details
Closed on
Apr 26, 2002
Sold by
Wandel Peter R and Wandel Joann
Bought by
Sheedy Charlotte
Home Financials for this Owner
Home Financials are based on the most recent Mortgage that was taken out on this home.
Original Mortgage
$500,000
Interest Rate
5.87%
Mortgage Type
Purchase Money Mortgage
Create a Home Valuation Report for This Property
The Home Valuation Report is an in-depth analysis detailing your home's value as well as a comparison with similar homes in the area
Home Values in the Area
Average Home Value in this Area
Purchase History
| Date | Buyer | Sale Price | Title Company |
|---|---|---|---|
| Sibeud Eugenie B | $995,000 | Jonathan J Platt | |
| Sibeud Eugenie B | $995,000 | Jonathan J Platt | |
| Sheedy Charlotte | $640,000 | Fidelity National Title Ins |
Source: Public Records
Mortgage History
| Date | Status | Borrower | Loan Amount |
|---|---|---|---|
| Previous Owner | Sheedy Charlotte | $500,000 |
Source: Public Records
Tax History Compared to Growth
Tax History
| Year | Tax Paid | Tax Assessment Tax Assessment Total Assessment is a certain percentage of the fair market value that is determined by local assessors to be the total taxable value of land and additions on the property. | Land | Improvement |
|---|---|---|---|---|
| 2024 | $3,825 | $1,377,200 | $1,190,900 | $186,300 |
| 2023 | $3,743 | $1,380,800 | $1,190,900 | $189,900 |
| 2022 | $3,696 | $1,361,000 | $1,190,900 | $170,100 |
| 2021 | $3,719 | $1,361,000 | $1,190,900 | $170,100 |
| 2020 | $7,293 | $1,361,000 | $1,190,900 | $170,100 |
| 2019 | $10,835 | $0 | $0 | $0 |
| 2018 | -- | $1,197,900 | $1,042,100 | $155,800 |
| 2017 | $6,882 | $1,197,900 | $1,042,100 | $155,800 |
| 2016 | $6,035 | $1,010,000 | $854,200 | $155,800 |
| 2015 | -- | $1,010,000 | $854,200 | $155,800 |
| 2014 | -- | $1,010,000 | $854,200 | $155,800 |
Source: Public Records
Map
Nearby Homes