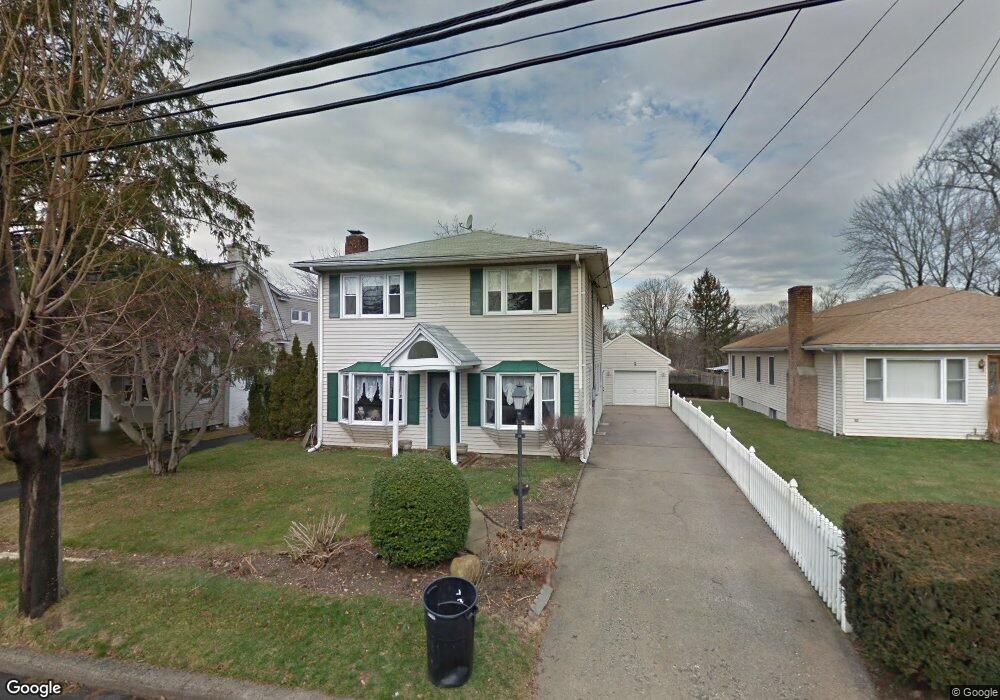
48 Grove St Glenwood Landing, NY 11547
Estimated Value: $943,000 - $969,175
4
Beds
2
Baths
2,080
Sq Ft
$460/Sq Ft
Est. Value
About This Home
This home is located at 48 Grove St, Glenwood Landing, NY 11547 and is currently estimated at $956,088, approximately $459 per square foot. 48 Grove St is a home located in Nassau County with nearby schools including North Shore Middle School, North Shore Senior High School, and Tiegerman Elementary School.
Ownership History
Date
Name
Owned For
Owner Type
Purchase Details
Closed on
Dec 11, 2020
Sold by
Mcaree Trust
Bought by
Zhang Jinghan and Lin Wenpin
Current Estimated Value
Home Financials for this Owner
Home Financials are based on the most recent Mortgage that was taken out on this home.
Original Mortgage
$576,000
Outstanding Balance
$513,726
Interest Rate
2.8%
Mortgage Type
New Conventional
Estimated Equity
$442,362
Create a Home Valuation Report for This Property
The Home Valuation Report is an in-depth analysis detailing your home's value as well as a comparison with similar homes in the area
Home Values in the Area
Average Home Value in this Area
Purchase History
| Date | Buyer | Sale Price | Title Company |
|---|---|---|---|
| Zhang Jinghan | $729,000 | None Available |
Source: Public Records
Mortgage History
| Date | Status | Borrower | Loan Amount |
|---|---|---|---|
| Open | Zhang Jinghan | $576,000 |
Source: Public Records
Tax History Compared to Growth
Tax History
| Year | Tax Paid | Tax Assessment Tax Assessment Total Assessment is a certain percentage of the fair market value that is determined by local assessors to be the total taxable value of land and additions on the property. | Land | Improvement |
|---|---|---|---|---|
| 2025 | $14,326 | $621 | $235 | $386 |
| 2024 | $4,519 | $651 | $246 | $405 |
| 2023 | $14,113 | $651 | $246 | $405 |
| 2022 | $14,113 | $630 | $179 | $451 |
| 2021 | $13,554 | $624 | $177 | $447 |
| 2020 | $12,228 | $944 | $602 | $342 |
| 2019 | $4,115 | $964 | $615 | $349 |
| 2018 | $6,824 | $964 | $0 | $0 |
| 2017 | $6,653 | $1,024 | $580 | $444 |
| 2016 | $10,705 | $1,085 | $570 | $515 |
| 2015 | $4,011 | $1,145 | $601 | $544 |
| 2014 | $4,011 | $1,145 | $601 | $544 |
| 2013 | $3,684 | $1,171 | $615 | $556 |
Source: Public Records
Map
Nearby Homes
- 46 Grove St
- 50 Grove St
- 50 Grove St Unit G
- 0 Grove St Unit 11586095
- 0 Grove St Unit 20 11512269
- 0 Grove St
- 49 Grove St
- 26 Grove St
- 44 Grove St
- 52 Grove St
- 26 Hillside Ave
- 28 Hillside Ave
- 28 Hillside Ave Unit A
- 24 Hillside Ave
- 51 Grove St
- 42 Grove St
- 53 Grove St Unit A
- 53 Grove St
- 20 Hillside Ave
- 30 Hillside Ave