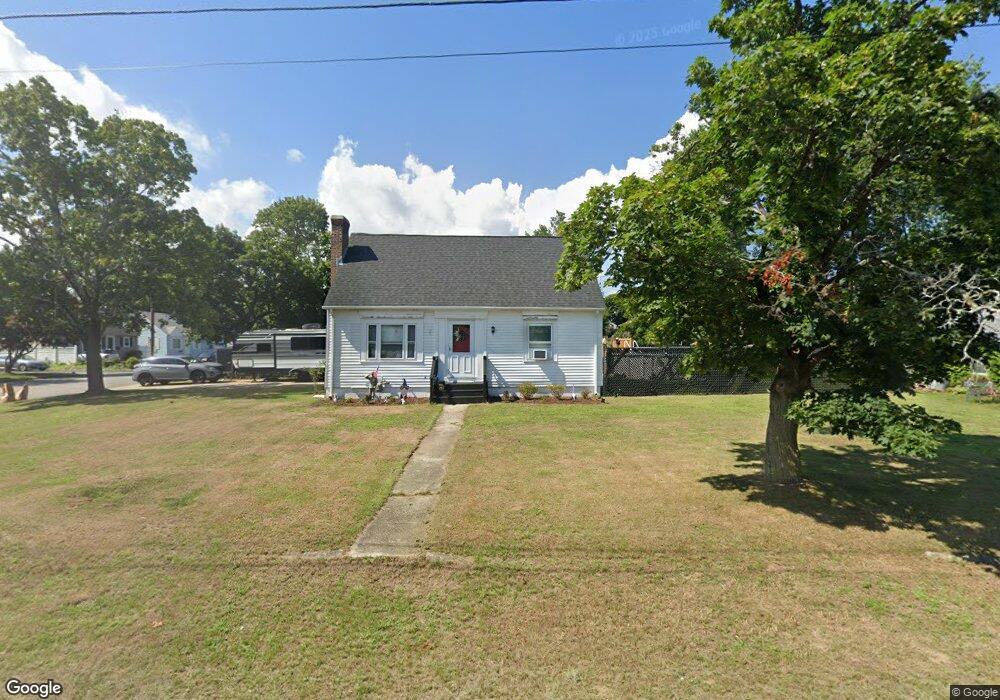
48 Harmony Ct Warwick, RI 02889
Hoxie NeighborhoodEstimated Value: $394,000 - $419,000
2
Beds
1
Bath
1,152
Sq Ft
$350/Sq Ft
Est. Value
About This Home
This home is located at 48 Harmony Ct, Warwick, RI 02889 and is currently estimated at $403,696, approximately $350 per square foot. 48 Harmony Ct is a home located in Kent County with nearby schools including Saint Kevin School and Bishop Hendricken High School.
Ownership History
Date
Name
Owned For
Owner Type
Purchase Details
Closed on
Mar 2, 2021
Sold by
Cummings Nancy
Bought by
Cummings Philip and Cummings Nancy
Current Estimated Value
Home Financials for this Owner
Home Financials are based on the most recent Mortgage that was taken out on this home.
Original Mortgage
$173,000
Outstanding Balance
$153,311
Interest Rate
2.7%
Mortgage Type
New Conventional
Estimated Equity
$250,385
Purchase Details
Closed on
Oct 8, 2009
Sold by
Wasilewski Nancy
Bought by
Wasilewski Nancy
Purchase Details
Closed on
Dec 26, 1995
Sold by
Blackmar Charles R
Bought by
Hesford Nancy
Home Financials for this Owner
Home Financials are based on the most recent Mortgage that was taken out on this home.
Original Mortgage
$86,900
Interest Rate
7.33%
Mortgage Type
Purchase Money Mortgage
Create a Home Valuation Report for This Property
The Home Valuation Report is an in-depth analysis detailing your home's value as well as a comparison with similar homes in the area
Home Values in the Area
Average Home Value in this Area
Purchase History
| Date | Buyer | Sale Price | Title Company |
|---|---|---|---|
| Cummings Philip | -- | None Available | |
| Wasilewski Nancy | -- | -- | |
| Hesford Nancy | $90,000 | -- |
Source: Public Records
Mortgage History
| Date | Status | Borrower | Loan Amount |
|---|---|---|---|
| Open | Cummings Philip | $173,000 | |
| Previous Owner | Hesford Nancy | $48,000 | |
| Previous Owner | Hesford Nancy | $125,000 | |
| Previous Owner | Hesford Nancy | $86,900 | |
| Previous Owner | Hesford Nancy | $58,000 |
Source: Public Records
Tax History
| Year | Tax Paid | Tax Assessment Tax Assessment Total Assessment is a certain percentage of the fair market value that is determined by local assessors to be the total taxable value of land and additions on the property. | Land | Improvement |
|---|---|---|---|---|
| 2025 | $4,528 | $356,500 | $113,400 | $243,100 |
| 2024 | $4,292 | $296,600 | $93,600 | $203,000 |
| 2023 | $4,209 | $296,600 | $93,600 | $203,000 |
| 2022 | $4,064 | $217,000 | $65,700 | $151,300 |
| 2021 | $4,064 | $217,000 | $65,700 | $151,300 |
| 2020 | $4,064 | $217,000 | $65,700 | $151,300 |
| 2019 | $4,064 | $217,000 | $65,700 | $151,300 |
| 2018 | $3,481 | $172,000 | $58,800 | $113,200 |
| 2017 | $3,481 | $172,000 | $58,800 | $113,200 |
| 2016 | $3,481 | $172,000 | $58,800 | $113,200 |
| 2015 | $3,164 | $152,500 | $68,000 | $84,500 |
| 2014 | $3,059 | $152,500 | $68,000 | $84,500 |
| 2013 | $2,992 | $151,200 | $68,000 | $83,200 |
Source: Public Records
Map
Nearby Homes
- 49 Recess Ln
- 14 Recess Ln
- 33 Recess Ln
- 21 Sarah Ln
- 12 Dean Ct
- 48 Rowe Ave
- 39 Holiday Ave
- 72 W Shore Rd Unit 104
- 72 W Shore Rd Unit 3
- 20 Commodore Ave
- 52 Dahlia St
- 15 Christopher Rhodes Way
- 6 Christopher Rhodes Way
- 44 Woodstock Dr
- 108 Fern St
- 80 Twin Oak Dr
- 0 Bethel St
- 54 Ansonia Rd
- 90 Massachusetts Ave
- 77 Kentucky Ave
Your Personal Tour Guide
Ask me questions while you tour the home.