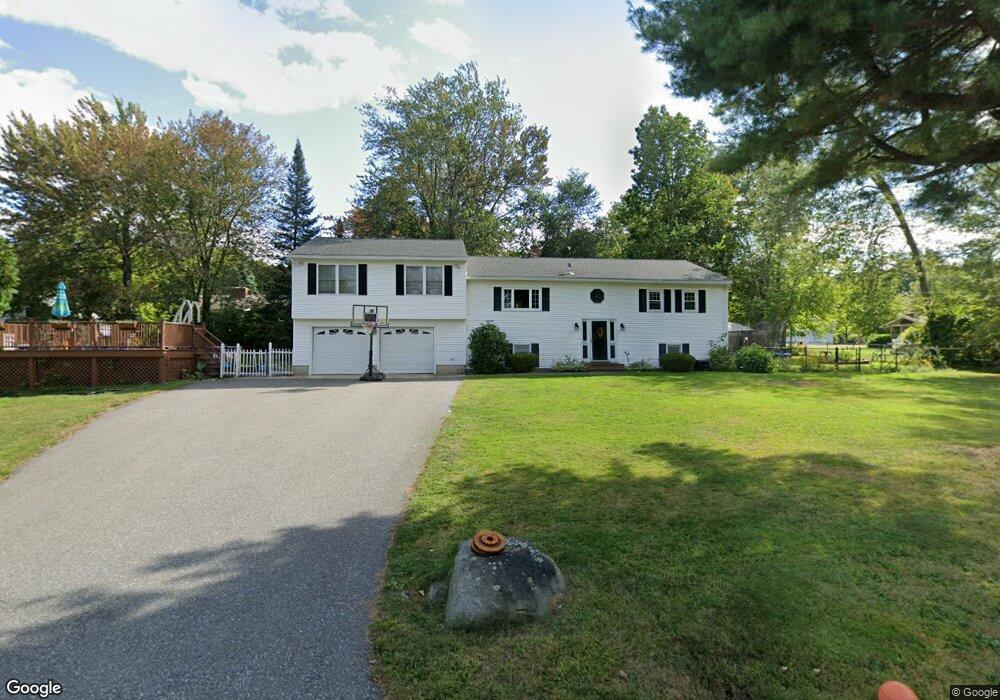
48 Harris St Methuen, MA 01844
The West End NeighborhoodEstimated Value: $730,364 - $824,000
3
Beds
3
Baths
2,645
Sq Ft
$297/Sq Ft
Est. Value
About This Home
This home is located at 48 Harris St, Methuen, MA 01844 and is currently estimated at $786,091, approximately $297 per square foot. 48 Harris St is a home located in Essex County with nearby schools including Marsh Grammar School, South Point Elementary School, and Methuen High School.
Ownership History
Date
Name
Owned For
Owner Type
Purchase Details
Closed on
Oct 31, 2008
Sold by
Becotte Patrick H and Becotte Maria E
Bought by
Casarano Steven M and Casarano Erika L
Current Estimated Value
Home Financials for this Owner
Home Financials are based on the most recent Mortgage that was taken out on this home.
Original Mortgage
$328,500
Outstanding Balance
$211,151
Interest Rate
5.83%
Mortgage Type
Purchase Money Mortgage
Estimated Equity
$574,940
Purchase Details
Closed on
Jul 21, 1992
Sold by
Manzi Edward C
Bought by
Becotte Patrick H
Home Financials for this Owner
Home Financials are based on the most recent Mortgage that was taken out on this home.
Original Mortgage
$106,000
Interest Rate
8.54%
Mortgage Type
Purchase Money Mortgage
Create a Home Valuation Report for This Property
The Home Valuation Report is an in-depth analysis detailing your home's value as well as a comparison with similar homes in the area
Home Values in the Area
Average Home Value in this Area
Purchase History
| Date | Buyer | Sale Price | Title Company |
|---|---|---|---|
| Casarano Steven M | $365,000 | -- | |
| Casarano Steven M | $365,000 | -- | |
| Becotte Patrick H | $118,000 | -- |
Source: Public Records
Mortgage History
| Date | Status | Borrower | Loan Amount |
|---|---|---|---|
| Open | Casarano Steven M | $328,500 | |
| Closed | Becotte Patrick H | $328,500 | |
| Previous Owner | Becotte Patrick H | $106,000 |
Source: Public Records
Tax History Compared to Growth
Tax History
| Year | Tax Paid | Tax Assessment Tax Assessment Total Assessment is a certain percentage of the fair market value that is determined by local assessors to be the total taxable value of land and additions on the property. | Land | Improvement |
|---|---|---|---|---|
| 2025 | $6,356 | $600,800 | $246,400 | $354,400 |
| 2024 | $6,412 | $590,400 | $224,000 | $366,400 |
| 2023 | $6,111 | $522,300 | $200,000 | $322,300 |
| 2022 | $5,811 | $445,300 | $160,000 | $285,300 |
| 2021 | $5,524 | $418,800 | $152,000 | $266,800 |
| 2020 | $5,479 | $407,700 | $152,000 | $255,700 |
| 2019 | $5,351 | $377,100 | $144,000 | $233,100 |
| 2018 | $5,170 | $362,300 | $144,000 | $218,300 |
| 2017 | $4,972 | $339,400 | $144,000 | $195,400 |
| 2016 | $4,912 | $331,700 | $144,000 | $187,700 |
| 2015 | $4,786 | $327,800 | $144,000 | $183,800 |
Source: Public Records
Map
Nearby Homes
- 96 Harris St
- 1 Bridle Path Ln
- 131 Bridle Path Ln
- 2 Campus Rd
- 128 West St
- 221 Pelham St
- 220 Pelham St
- 73 Myrtle St
- 150 Hampshire Rd
- 1 Tilbury Rd
- 0 Carmel Rd Unit 6
- 90 Butternut Ln
- 14 Tedesco Rd
- 86 Butternut Ln
- 20 Canobieola Rd
- 280 & 290 Spring Rd
- 351 Peters Pond Dr
- 39 Ticklefancy Ln
- 50 & 51 Jane St
- 38 Butternut Ln