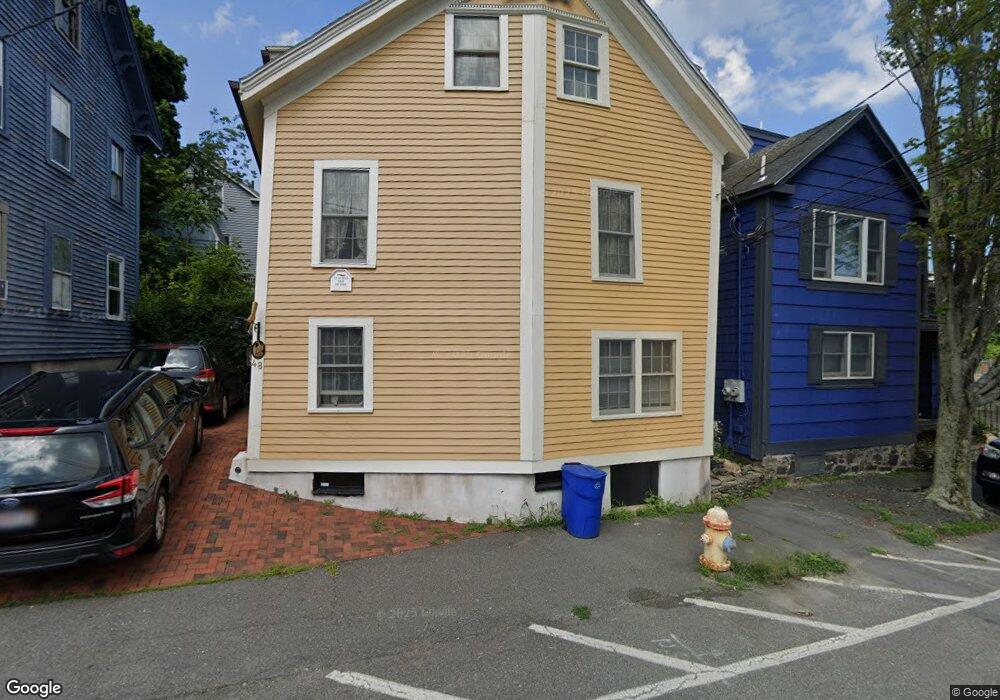
48 Hawkes St Unit 1 Marblehead, MA 01945
Estimated Value: $730,000 - $811,000
1
Bed
1
Bath
425
Sq Ft
$1,774/Sq Ft
Est. Value
About This Home
This home is located at 48 Hawkes St Unit 1, Marblehead, MA 01945 and is currently estimated at $754,085, approximately $1,774 per square foot. 48 Hawkes St Unit 1 is a home located in Essex County with nearby schools including Marblehead High School, Marblehead Community Charter Public School, and Devereux School.
Ownership History
Date
Name
Owned For
Owner Type
Purchase Details
Closed on
Dec 6, 2024
Sold by
Underwood Erin M and Underwood Thomas A
Bought by
Erin Maureen Underwood Rt and Underwood
Current Estimated Value
Purchase Details
Closed on
Jul 21, 2006
Sold by
Underwood Erin M and Underwood Thomas A
Bought by
Underwood Erin M
Purchase Details
Closed on
Jun 30, 2004
Sold by
Jerin Robert A
Bought by
Hewitt Erin and Underwood Thomas A
Purchase Details
Closed on
Sep 29, 1999
Sold by
Miller William C
Bought by
Jerin Robert A
Purchase Details
Closed on
Jun 15, 1987
Sold by
Colantuno Ralph
Bought by
Miller William C
Create a Home Valuation Report for This Property
The Home Valuation Report is an in-depth analysis detailing your home's value as well as a comparison with similar homes in the area
Home Values in the Area
Average Home Value in this Area
Purchase History
| Date | Buyer | Sale Price | Title Company |
|---|---|---|---|
| Erin Maureen Underwood Rt | -- | None Available | |
| Erin Maureen Underwood Rt | -- | None Available | |
| Underwood Erin M | -- | -- | |
| Underwood Erin M | -- | -- | |
| Hewitt Erin | $287,500 | -- | |
| Hewitt Erin | $287,500 | -- | |
| Jerin Robert A | $175,000 | -- | |
| Jerin Robert A | $175,000 | -- | |
| Miller William C | $215,500 | -- |
Source: Public Records
Mortgage History
| Date | Status | Borrower | Loan Amount |
|---|---|---|---|
| Previous Owner | Miller William C | $32,000 | |
| Previous Owner | Miller William C | $200,000 |
Source: Public Records
Tax History Compared to Growth
Tax History
| Year | Tax Paid | Tax Assessment Tax Assessment Total Assessment is a certain percentage of the fair market value that is determined by local assessors to be the total taxable value of land and additions on the property. | Land | Improvement |
|---|---|---|---|---|
| 2025 | $5,603 | $619,100 | $434,300 | $184,800 |
| 2024 | $5,402 | $602,900 | $472,900 | $130,000 |
| 2023 | $4,903 | $490,300 | $366,700 | $123,600 |
| 2022 | $4,513 | $429,000 | $313,600 | $115,400 |
| 2021 | $4,119 | $395,300 | $279,900 | $115,400 |
| 2020 | $4,422 | $425,600 | $318,500 | $107,100 |
| 2019 | $4,052 | $377,300 | $270,200 | $107,100 |
| 2018 | $4,052 | $367,700 | $260,600 | $107,100 |
| 2017 | $3,836 | $348,400 | $241,300 | $107,100 |
| 2016 | $3,641 | $328,000 | $222,000 | $106,000 |
| 2015 | $3,527 | $318,300 | $212,300 | $106,000 |
| 2014 | $3,265 | $294,400 | $193,000 | $101,400 |
Source: Public Records
Map
Nearby Homes
- 2 Lindsey St
- 15 Lindsey St
- 60 Gregory St Unit 3
- 41 Atlantic Ave Unit 1
- 9 Skinner's Path Unit 9
- 33 Waldron St
- 290 Washington St Unit 3
- 290 Washington St Unit 2
- 290 Washington St Unit 1
- 41 Rowland St
- 9 Darling St
- 19 Linden St
- 12 Heritage Way Unit 12
- 45 Pleasant St
- 29 Village St Unit 1
- 134 Elm St
- 132 Elm St
- 132 Elm St Unit 132
- 1 Green St Unit 2
- 95 Front St Unit 5
- 48 Hawkes St
- 50 Hawkes St
- 46 Hawkes St
- 46 Hawkes St Unit 1
- 4 Lindsey St
- 4R Lindsey St
- 6 Lindsey St
- 32 Hawkes St
- 43 Hawkes St Unit 3
- 43 Hawkes St Unit 2
- 43 Hawkes St Unit 1
- 8 Lindsey St
- 26 Barnard St
- 41 Hawkes St
- 41 Hawkes St Unit 2
- 41 Hawkes St Unit 1
- 54 Hawkes St
- 54 Hawkes St Unit 1
- 10 Lindsey St
- 5 Lindsey St