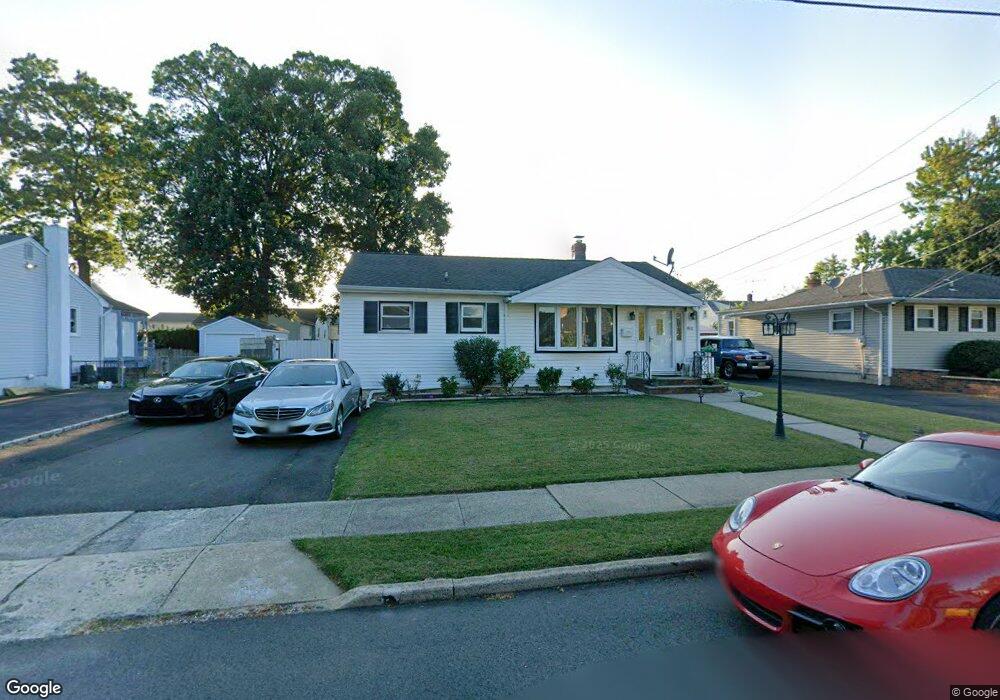
48 Hickory St Edison, NJ 08817
Estimated Value: $468,000 - $535,000
2
Beds
1
Bath
1,403
Sq Ft
$365/Sq Ft
Est. Value
About This Home
This home is located at 48 Hickory St, Edison, NJ 08817 and is currently estimated at $512,412, approximately $365 per square foot. 48 Hickory St is a home located in Middlesex County with nearby schools including Lindeneau Elementary School, Thomas Jefferson Middle School, and Edison High School.
Ownership History
Date
Name
Owned For
Owner Type
Purchase Details
Closed on
Apr 28, 2020
Sold by
Calinda Eric and Calinda Mackenzie
Bought by
Lan Di and Ning Yilu
Current Estimated Value
Home Financials for this Owner
Home Financials are based on the most recent Mortgage that was taken out on this home.
Original Mortgage
$180,000
Outstanding Balance
$160,392
Interest Rate
3.6%
Mortgage Type
New Conventional
Estimated Equity
$352,020
Purchase Details
Closed on
Aug 31, 2017
Sold by
Calinda Cynthia M and Calinda Eric
Bought by
Calinda Eric and Calinda Mackenzie
Purchase Details
Closed on
Dec 22, 2014
Sold by
Calinda Cynthia M
Bought by
Calinda Cynthia M and Wolk Mary Ann
Create a Home Valuation Report for This Property
The Home Valuation Report is an in-depth analysis detailing your home's value as well as a comparison with similar homes in the area
Home Values in the Area
Average Home Value in this Area
Purchase History
| Date | Buyer | Sale Price | Title Company |
|---|---|---|---|
| Lan Di | $271,500 | Title Authority Llc | |
| Calinda Eric | -- | Homecoming Title & Settlemen | |
| Calinda Cynthia M | $120,600 | Homecoming Title & Settlemen |
Source: Public Records
Mortgage History
| Date | Status | Borrower | Loan Amount |
|---|---|---|---|
| Open | Lan Di | $180,000 |
Source: Public Records
Tax History
| Year | Tax Paid | Tax Assessment Tax Assessment Total Assessment is a certain percentage of the fair market value that is determined by local assessors to be the total taxable value of land and additions on the property. | Land | Improvement |
|---|---|---|---|---|
| 2025 | $9,060 | $152,200 | $75,500 | $76,700 |
| 2024 | $9,012 | $152,200 | $75,500 | $76,700 |
Source: Public Records
Map
Nearby Homes
- 89 Hickory St
- 45 Loring Ave
- 59 Oakland Ave
- 23 Morse Ave
- 39 Prospect Ave
- 206 Plainfield Ave
- 65 Orange St
- 9 Gates Place
- 61 Duley Ave
- 13 Columbus Ave
- 12 Old Post Rd
- 31 Hull Dr
- 225 Penn Ave
- 223 Plainfield Ave
- 346 N Riverview Ave
- 66 Garden Terrace
- 20 Clark Ave
- 226 Wellington Place
- 47 Stony Rd
- 2 Clark Ave