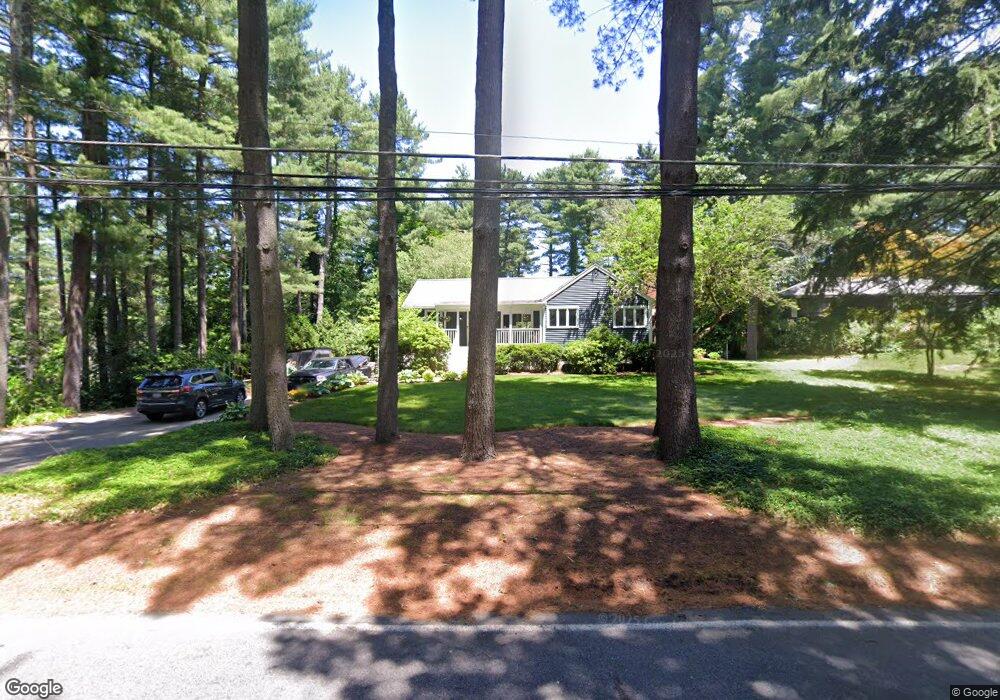
48 High St Walpole, MA 02081
Estimated Value: $621,000 - $673,000
3
Beds
2
Baths
1,383
Sq Ft
$469/Sq Ft
Est. Value
About This Home
This home is located at 48 High St, Walpole, MA 02081 and is currently estimated at $648,094, approximately $468 per square foot. 48 High St is a home located in Norfolk County with nearby schools including Elm Street School, Eleanor N. Johnson Middle School, and Walpole High School.
Ownership History
Date
Name
Owned For
Owner Type
Purchase Details
Closed on
May 8, 2017
Sold by
Bethoney Ft
Bought by
Keaveney Matthew and Keaveney Marianna
Current Estimated Value
Home Financials for this Owner
Home Financials are based on the most recent Mortgage that was taken out on this home.
Original Mortgage
$358,900
Outstanding Balance
$298,114
Interest Rate
4.23%
Mortgage Type
New Conventional
Estimated Equity
$349,980
Purchase Details
Closed on
Oct 31, 1995
Sold by
Ferri Erika
Bought by
Bethoney Naiff and Bethoney Peter
Create a Home Valuation Report for This Property
The Home Valuation Report is an in-depth analysis detailing your home's value as well as a comparison with similar homes in the area
Home Values in the Area
Average Home Value in this Area
Purchase History
| Date | Buyer | Sale Price | Title Company |
|---|---|---|---|
| Keaveney Matthew | $370,000 | -- | |
| Bethoney Naiff | $195,000 | -- |
Source: Public Records
Mortgage History
| Date | Status | Borrower | Loan Amount |
|---|---|---|---|
| Open | Keaveney Matthew | $358,900 |
Source: Public Records
Tax History
| Year | Tax Paid | Tax Assessment Tax Assessment Total Assessment is a certain percentage of the fair market value that is determined by local assessors to be the total taxable value of land and additions on the property. | Land | Improvement |
|---|---|---|---|---|
| 2025 | $7,668 | $597,700 | $356,700 | $241,000 |
| 2024 | $7,424 | $561,600 | $342,900 | $218,700 |
| 2023 | $7,171 | $516,300 | $298,200 | $218,100 |
| 2022 | $6,801 | $470,300 | $276,100 | $194,200 |
| 2021 | $6,418 | $432,500 | $260,500 | $172,000 |
| 2020 | $6,360 | $424,300 | $245,800 | $178,500 |
| 2019 | $6,177 | $409,100 | $236,300 | $172,800 |
| 2018 | $5,711 | $374,000 | $227,500 | $146,500 |
| 2017 | $5,540 | $361,400 | $218,800 | $142,600 |
| 2016 | $5,343 | $343,400 | $212,000 | $131,400 |
| 2015 | $5,195 | $330,900 | $201,900 | $129,000 |
| 2014 | $5,009 | $317,800 | $201,900 | $115,900 |
Source: Public Records
Map
Nearby Homes
- 19 and 23 Arlington Ln
- 56 North St
- 291 Plimpton St
- 7 Tilton Ct Unit Ct
- 241 Fisher St
- 26 Dover Dr
- 881 Main St Unit 9
- 260 Elm St
- 8 Mckinley Ave
- 6 Litchfields Way
- 2 Kendall St
- 28 Eastover Rd Unit 28
- 222 School St Unit 9
- 224 School St Unit 9
- 115 High St
- 1110 Main St
- 26 Drake Cir
- 50 Riverside Place
- 111 Elm St
- 38 Garden Pkwy
Your Personal Tour Guide
Ask me questions while you tour the home.