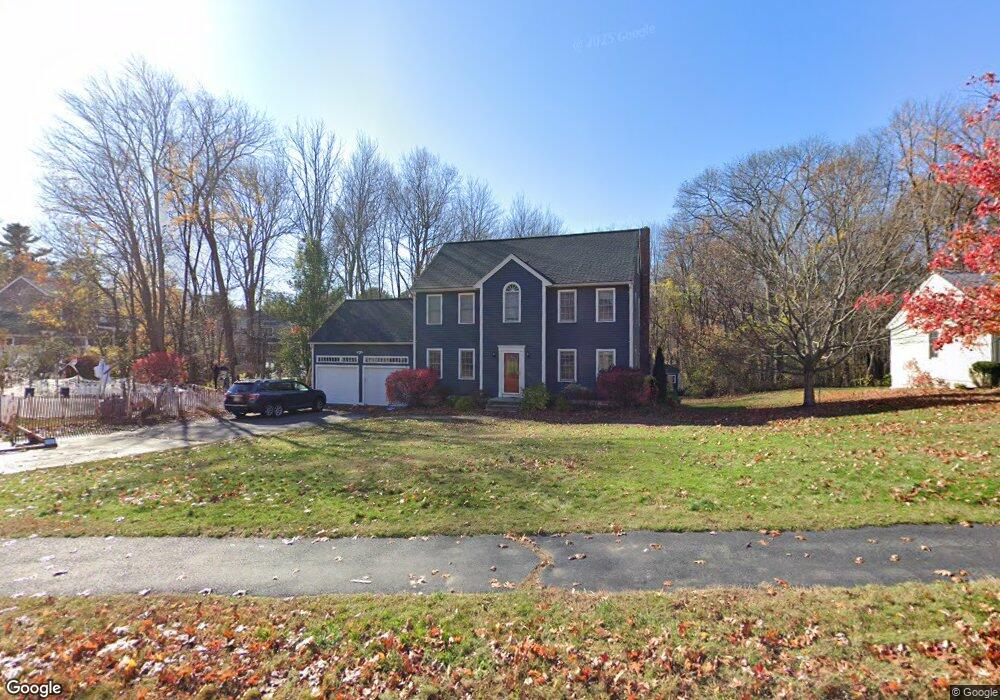
48 Hillando Dr Shrewsbury, MA 01545
Estimated Value: $800,240 - $1,223,000
4
Beds
3
Baths
2,044
Sq Ft
$476/Sq Ft
Est. Value
About This Home
This home is located at 48 Hillando Dr, Shrewsbury, MA 01545 and is currently estimated at $972,060, approximately $475 per square foot. 48 Hillando Dr is a home located in Worcester County with nearby schools including Floral Street School, Sherwood Middle School, and Oak Middle School.
Ownership History
Date
Name
Owned For
Owner Type
Purchase Details
Closed on
Jul 8, 2011
Sold by
Raman Raghu and Krishnamurthy Aruna
Bought by
Mcnamara Sean E and Mcardle Margaret E
Current Estimated Value
Home Financials for this Owner
Home Financials are based on the most recent Mortgage that was taken out on this home.
Original Mortgage
$376,800
Outstanding Balance
$258,455
Interest Rate
4.6%
Mortgage Type
Purchase Money Mortgage
Estimated Equity
$713,605
Purchase Details
Closed on
Oct 15, 2004
Sold by
Hejduk Franklin G and Hejduk Heather J
Bought by
Krishnamurthy Aruna and Raman Raghu
Purchase Details
Closed on
Aug 23, 1999
Sold by
Rivera John E and Rivera Kim D
Bought by
Hejduk Heather J and Hejduk Franklin G
Purchase Details
Closed on
Nov 24, 1993
Sold by
Lodge Corp
Bought by
Rivera John E and Rivera Kim
Create a Home Valuation Report for This Property
The Home Valuation Report is an in-depth analysis detailing your home's value as well as a comparison with similar homes in the area
Home Values in the Area
Average Home Value in this Area
Purchase History
| Date | Buyer | Sale Price | Title Company |
|---|---|---|---|
| Mcnamara Sean E | $471,000 | -- | |
| Mcnamara Sean E | $471,000 | -- | |
| Mcnamara Sean E | $471,000 | -- | |
| Krishnamurthy Aruna | $483,500 | -- | |
| Krishnamurthy Aruna | $483,500 | -- | |
| Krishnamurthy Aruna | $483,500 | -- | |
| Hejduk Heather J | $293,000 | -- | |
| Hejduk Heather J | $293,000 | -- | |
| Rivera John E | $217,000 | -- |
Source: Public Records
Mortgage History
| Date | Status | Borrower | Loan Amount |
|---|---|---|---|
| Open | Mcnamara Sean E | $376,800 | |
| Closed | Mcnamara Sean E | $376,800 | |
| Previous Owner | Rivera John E | $359,000 |
Source: Public Records
Tax History Compared to Growth
Tax History
| Year | Tax Paid | Tax Assessment Tax Assessment Total Assessment is a certain percentage of the fair market value that is determined by local assessors to be the total taxable value of land and additions on the property. | Land | Improvement |
|---|---|---|---|---|
| 2025 | $89 | $739,900 | $263,000 | $476,900 |
| 2024 | $8,873 | $716,700 | $250,400 | $466,300 |
| 2023 | $8,288 | $631,700 | $250,400 | $381,300 |
| 2022 | $7,275 | $515,600 | $196,800 | $318,800 |
| 2021 | $6,501 | $492,900 | $196,800 | $296,100 |
| 2020 | $6,110 | $490,000 | $196,800 | $293,200 |
| 2019 | $5,838 | $464,400 | $183,900 | $280,500 |
| 2018 | $5,870 | $463,700 | $173,300 | $290,400 |
| 2017 | $5,585 | $435,300 | $156,900 | $278,400 |
| 2016 | $5,608 | $431,400 | $147,000 | $284,400 |
| 2015 | $5,450 | $412,900 | $134,500 | $278,400 |
Source: Public Records
Map
Nearby Homes
- 39 Harvard Ave
- 65 Commons Dr Unit 502
- 65 Commons Dr Unit 410
- 22 Hitching Post Ln
- 85 Commons Dr Unit 210
- 11 Hillside Rd
- 24 Brook St
- 562 South St
- 10 Falcon Dr
- 39 Old Brook Rd
- 457 Walnut St
- 139 Davis St
- 603 South St
- 3 Brookdale Cir
- 243 Spring St
- 4 Horseneck Rd
- 26 High St
- 40 High St
- 18 Eastwood Rd
- 1 Hamilton Rd
- 46 Hillando Dr
- 51 Hillando Dr
- 56 Hillando Dr
- 49 Hillando Dr
- 44 Hillando Dr
- 58 Hillando Dr
- 60 Hillando Dr
- 53 Hillando Dr
- 62 Hillando Dr
- 47 Hillando Dr
- 55 Hillando Dr
- 42 Hillando Dr
- 1 Old Farm Cir
- 45 Hillando Dr
- 9 Bayberry Cir
- 11 Bayberry Cir
- 2 Old Farm Cir
- 61 Hillando Dr
- 40 Hillando Dr
- 63 Hillando Dr