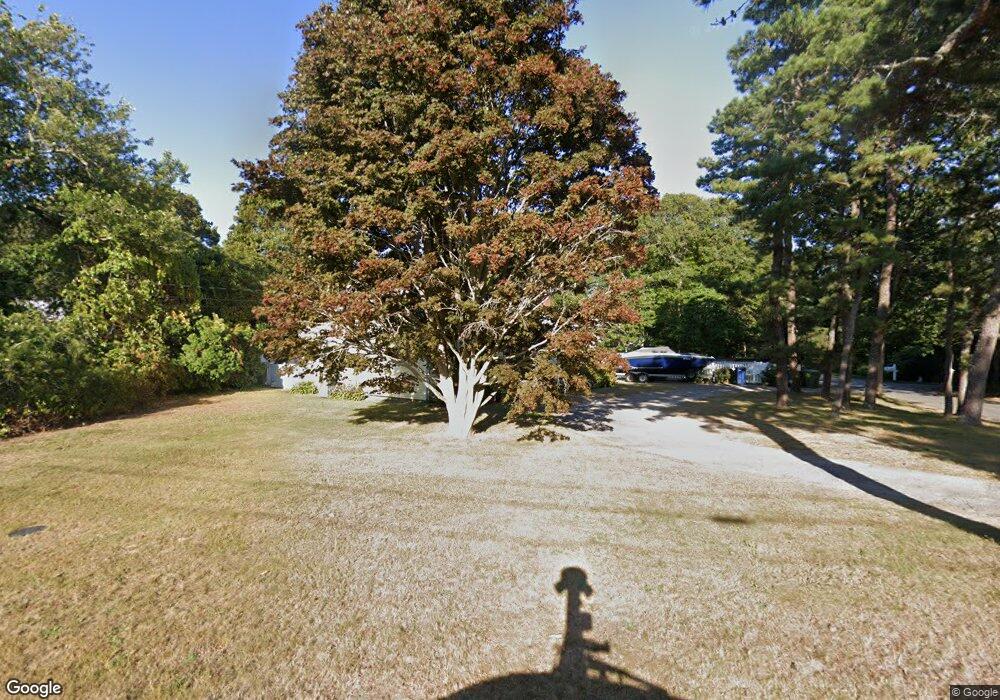
48 Isalene Rd Hyannis, MA 02601
Estimated Value: $561,000 - $624,624
3
Beds
1
Bath
1,201
Sq Ft
$498/Sq Ft
Est. Value
About This Home
This home is located at 48 Isalene Rd, Hyannis, MA 02601 and is currently estimated at $598,656, approximately $498 per square foot. 48 Isalene Rd is a home located in Barnstable County with nearby schools including Hyannis West Elementary School, Barnstable United Elementary School, and Barnstable Intermediate School.
Ownership History
Date
Name
Owned For
Owner Type
Purchase Details
Closed on
Apr 3, 2014
Sold by
Hearn John P and Hearn Caroline S
Bought by
48 Isalene Street Rt
Current Estimated Value
Purchase Details
Closed on
Sep 22, 2009
Sold by
48 Isalene Street Rt
Bought by
Hearn Ft
Purchase Details
Closed on
May 1, 1998
Sold by
Abdelahad Fred R and Abdelahad Marianne
Bought by
Hearn John P
Home Financials for this Owner
Home Financials are based on the most recent Mortgage that was taken out on this home.
Original Mortgage
$80,000
Interest Rate
7.04%
Mortgage Type
Purchase Money Mortgage
Create a Home Valuation Report for This Property
The Home Valuation Report is an in-depth analysis detailing your home's value as well as a comparison with similar homes in the area
Home Values in the Area
Average Home Value in this Area
Purchase History
| Date | Buyer | Sale Price | Title Company |
|---|---|---|---|
| 48 Isalene Street Rt | -- | -- | |
| Hearn Ft | -- | -- | |
| Hearn John P | $117,900 | -- |
Source: Public Records
Mortgage History
| Date | Status | Borrower | Loan Amount |
|---|---|---|---|
| Previous Owner | Hearn John P | $80,000 | |
| Previous Owner | Hearn John P | $94,000 |
Source: Public Records
Tax History Compared to Growth
Tax History
| Year | Tax Paid | Tax Assessment Tax Assessment Total Assessment is a certain percentage of the fair market value that is determined by local assessors to be the total taxable value of land and additions on the property. | Land | Improvement |
|---|---|---|---|---|
| 2025 | $4,714 | $508,500 | $174,000 | $334,500 |
| 2024 | $4,536 | $501,200 | $174,000 | $327,200 |
| 2023 | $4,359 | $455,500 | $171,900 | $283,600 |
| 2022 | $4,230 | $365,600 | $122,200 | $243,400 |
| 2021 | $3,816 | $320,400 | $122,200 | $198,200 |
| 2020 | $3,709 | $300,800 | $122,200 | $178,600 |
| 2019 | $3,424 | $280,100 | $122,200 | $157,900 |
| 2018 | $3,245 | $263,800 | $134,000 | $129,800 |
| 2017 | $3,455 | $257,300 | $134,000 | $123,300 |
| 2016 | $2,895 | $246,800 | $135,000 | $111,800 |
| 2015 | $2,840 | $245,500 | $130,500 | $115,000 |
Source: Public Records
Map
Nearby Homes