Estimated Value: $671,000 - $824,000
--
Bed
--
Bath
1,928
Sq Ft
$372/Sq Ft
Est. Value
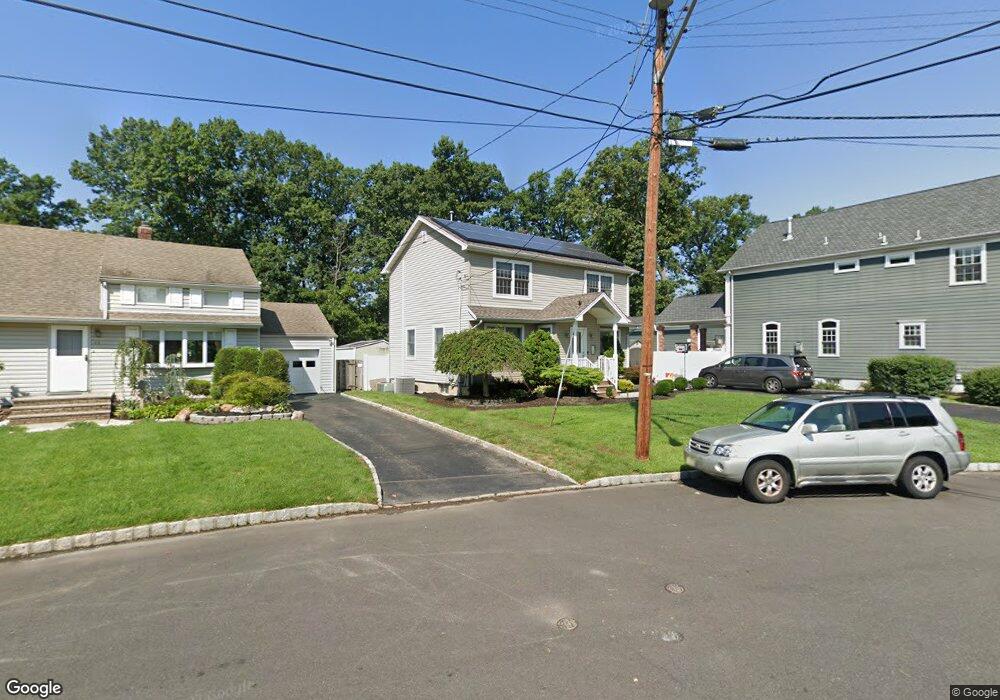
About This Home
This home is located at 48 Ivy St, Clark, NJ 07066 and is currently estimated at $717,159, approximately $371 per square foot. 48 Ivy St is a home located in Union County with nearby schools including Valley Road Elementary School, Carl H. Kumpf Middle School, and Arthur L. Johnson High School.
Ownership History
Date
Name
Owned For
Owner Type
Purchase Details
Closed on
Jul 12, 2005
Sold by
Pettenato Robert
Bought by
Pettenato Robert and Pettenato Ellen
Current Estimated Value
Home Financials for this Owner
Home Financials are based on the most recent Mortgage that was taken out on this home.
Original Mortgage
$304,900
Outstanding Balance
$158,441
Interest Rate
5.59%
Mortgage Type
New Conventional
Estimated Equity
$558,718
Purchase Details
Closed on
Jul 14, 2004
Sold by
Benish Candy
Bought by
Pettenato Robert and Chamberlain Ellen
Home Financials for this Owner
Home Financials are based on the most recent Mortgage that was taken out on this home.
Original Mortgage
$271,000
Interest Rate
6.33%
Purchase Details
Closed on
Nov 25, 2003
Sold by
Nellis Scott
Bought by
Benish Candy
Purchase Details
Closed on
Dec 20, 1999
Sold by
Nellis Donna Carney
Bought by
Nellis Scott W and Benish Candy S
Purchase Details
Closed on
May 12, 1999
Sold by
Nellis Gwen M
Bought by
Benish Candy S and Nellis Scott W
Create a Home Valuation Report for This Property
The Home Valuation Report is an in-depth analysis detailing your home's value as well as a comparison with similar homes in the area
Home Values in the Area
Average Home Value in this Area
Purchase History
| Date | Buyer | Sale Price | Title Company |
|---|---|---|---|
| Pettenato Robert | -- | -- | |
| Pettenato Robert | $371,000 | -- | |
| Benish Candy | $10,000 | -- | |
| Nellis Scott W | -- | -- | |
| Benish Candy S | -- | -- |
Source: Public Records
Mortgage History
| Date | Status | Borrower | Loan Amount |
|---|---|---|---|
| Open | Pettenato Robert | $304,900 | |
| Previous Owner | Pettenato Robert | $271,000 |
Source: Public Records
Tax History Compared to Growth
Tax History
| Year | Tax Paid | Tax Assessment Tax Assessment Total Assessment is a certain percentage of the fair market value that is determined by local assessors to be the total taxable value of land and additions on the property. | Land | Improvement |
|---|---|---|---|---|
| 2025 | $11,630 | $525,300 | $272,600 | $252,700 |
| 2024 | $11,457 | $525,300 | $272,600 | $252,700 |
| 2023 | $11,457 | $525,300 | $272,600 | $252,700 |
| 2022 | $11,126 | $525,300 | $272,600 | $252,700 |
| 2021 | $10,206 | $114,800 | $42,800 | $72,000 |
| 2020 | $9,436 | $107,900 | $42,800 | $65,100 |
| 2019 | $9,341 | $107,900 | $42,800 | $65,100 |
| 2018 | $9,229 | $107,900 | $42,800 | $65,100 |
| 2017 | $9,081 | $107,900 | $42,800 | $65,100 |
| 2016 | $8,746 | $107,900 | $42,800 | $65,100 |
| 2015 | $8,658 | $107,900 | $42,800 | $65,100 |
| 2014 | $8,476 | $107,900 | $42,800 | $65,100 |
Source: Public Records
Map
Nearby Homes
- 1081 Madison Hill Rd
- 44 Post Rd
- 53 Richard St
- 1169 Briarcliff Dr
- 1120 Greslin Terrace
- 741 Brookside Rd
- 1218 Kline Place
- 22 Washington St
- 1095 Elm Terrace
- 1126 Stone St
- 157 Westfield Ave
- 12 Bartell Place
- 789 Hillside Rd
- 992 Milton Blvd
- 1374 Lambert St
- 30 Brant Ave
- 27 Grand St
- 1062 Westfield Ave
- 5 Elizabeth Ct
- 45 Lexington Blvd