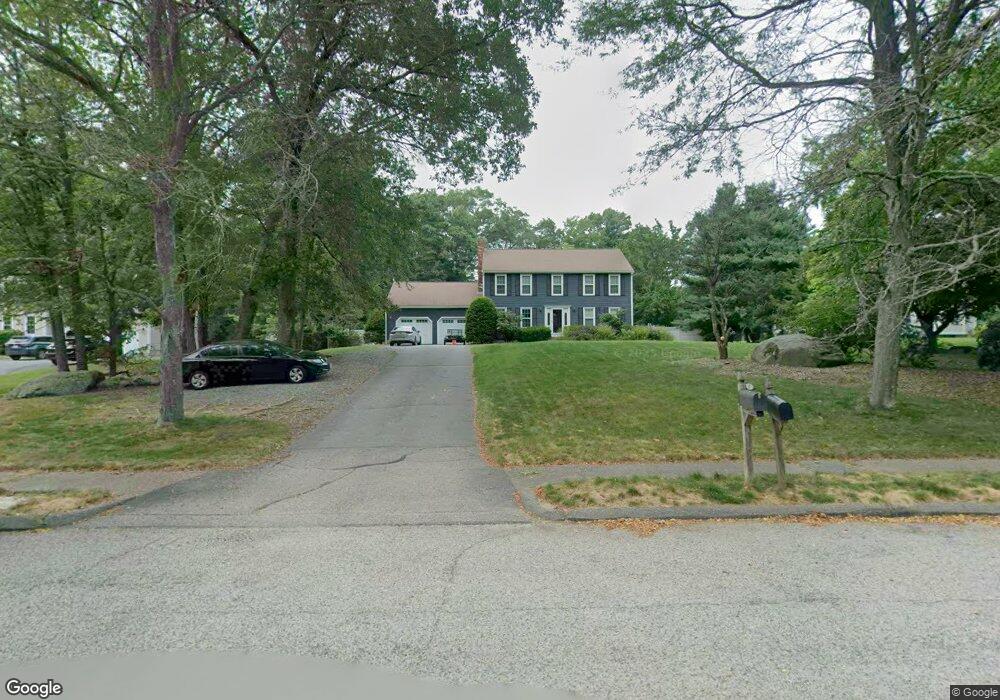
48 Jacob Dr Mansfield, MA 02048
Estimated Value: $851,717 - $947,000
4
Beds
3
Baths
2,128
Sq Ft
$423/Sq Ft
Est. Value
About This Home
This home is located at 48 Jacob Dr, Mansfield, MA 02048 and is currently estimated at $901,179, approximately $423 per square foot. 48 Jacob Dr is a home located in Bristol County with nearby schools including Everett W. Robinson Elementary School, Jordan/Jackson Elementary School, and Harold L. Qualters Middle School.
Ownership History
Date
Name
Owned For
Owner Type
Purchase Details
Closed on
Dec 11, 2009
Sold by
Mctarnaghan Daniel A and Mctarnaghan Janet I
Bought by
Walsh Philip J and Mcgill-Walsh Bernadette
Current Estimated Value
Home Financials for this Owner
Home Financials are based on the most recent Mortgage that was taken out on this home.
Original Mortgage
$414,400
Outstanding Balance
$271,955
Interest Rate
5.02%
Mortgage Type
Purchase Money Mortgage
Estimated Equity
$629,224
Create a Home Valuation Report for This Property
The Home Valuation Report is an in-depth analysis detailing your home's value as well as a comparison with similar homes in the area
Home Values in the Area
Average Home Value in this Area
Purchase History
| Date | Buyer | Sale Price | Title Company |
|---|---|---|---|
| Walsh Philip J | $518,000 | -- |
Source: Public Records
Mortgage History
| Date | Status | Borrower | Loan Amount |
|---|---|---|---|
| Open | Walsh Philip J | $414,400 |
Source: Public Records
Tax History
| Year | Tax Paid | Tax Assessment Tax Assessment Total Assessment is a certain percentage of the fair market value that is determined by local assessors to be the total taxable value of land and additions on the property. | Land | Improvement |
|---|---|---|---|---|
| 2025 | $10,096 | $766,600 | $266,000 | $500,600 |
| 2024 | $9,952 | $737,200 | $278,100 | $459,100 |
| 2023 | $9,597 | $681,100 | $278,100 | $403,000 |
| 2022 | $9,205 | $606,800 | $257,400 | $349,400 |
| 2021 | $4,721 | $589,800 | $242,600 | $347,200 |
| 2020 | $8,921 | $580,800 | $242,600 | $338,200 |
| 2019 | $3,424 | $566,500 | $225,400 | $341,100 |
| 2018 | $4,166 | $550,100 | $214,900 | $335,200 |
| 2017 | $8,036 | $535,000 | $208,800 | $326,200 |
| 2016 | $8,015 | $520,100 | $229,000 | $291,100 |
| 2015 | $7,838 | $505,700 | $229,000 | $276,700 |
Source: Public Records
Map
Nearby Homes
- 128 Tremont St
- 24 Maverick Dr
- 17 Childs Ln
- 1769 West St
- 25 Shepherd St
- 14 Claire Ave
- 150 Gilbert St
- 401 South St
- 346 South St
- 40 Treasure Island Rd
- 9 Coach Rd
- 16 Treasure Island Rd
- 84 Messenger St
- 33 Colonial Way
- 25 Munroe Dr
- 166 Chauncy St
- 46 Mirimichi St
- 356 Central St
- 2 Oak St Unit 2B
- 38 Mirimichi St
Your Personal Tour Guide
Ask me questions while you tour the home.