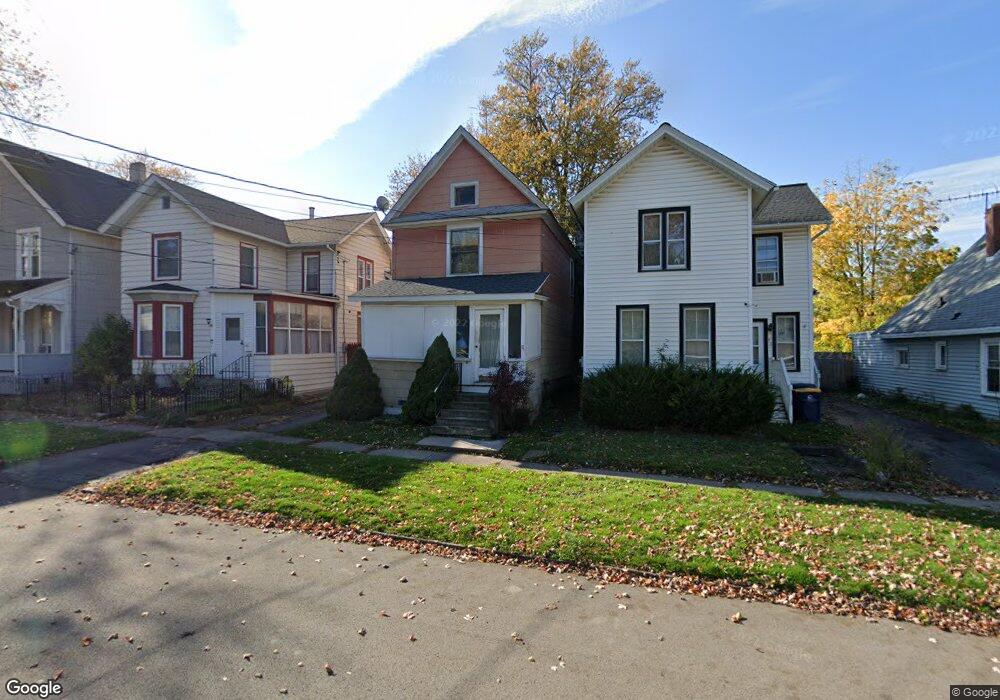
48 John St Lockport, NY 14094
Estimated Value: $58,000 - $138,000
3
Beds
1
Bath
1,464
Sq Ft
$66/Sq Ft
Est. Value
About This Home
This home is located at 48 John St, Lockport, NY 14094 and is currently estimated at $96,488, approximately $65 per square foot. 48 John St is a home located in Niagara County with nearby schools including Aaron Mossell Junior High School, Lockport High School, and DeSales Catholic School.
Ownership History
Date
Name
Owned For
Owner Type
Purchase Details
Closed on
Aug 30, 2025
Sold by
Equity Trust Company and Nathan Canazzi Ira
Bought by
Fatmo Llc
Current Estimated Value
Home Financials for this Owner
Home Financials are based on the most recent Mortgage that was taken out on this home.
Original Mortgage
$67,000
Outstanding Balance
$67,000
Interest Rate
6.74%
Mortgage Type
Construction
Estimated Equity
$29,488
Purchase Details
Closed on
Nov 14, 2024
Sold by
Mavrak Jeffrey J
Bought by
Equity Trust and Nathan Canazzi Ira
Purchase Details
Closed on
Feb 6, 2002
Sold by
Schwellnus Ernst
Bought by
Mavrak Jeffrey
Create a Home Valuation Report for This Property
The Home Valuation Report is an in-depth analysis detailing your home's value as well as a comparison with similar homes in the area
Home Values in the Area
Average Home Value in this Area
Purchase History
| Date | Buyer | Sale Price | Title Company |
|---|---|---|---|
| Fatmo Llc | $42,000 | None Listed On Document | |
| Equity Trust | $12,000 | Chicago Title | |
| Equity Trust | $12,000 | Chicago Title | |
| Mavrak Jeffrey | -- | -- |
Source: Public Records
Mortgage History
| Date | Status | Borrower | Loan Amount |
|---|---|---|---|
| Open | Fatmo Llc | $67,000 |
Source: Public Records
Tax History
| Year | Tax Paid | Tax Assessment Tax Assessment Total Assessment is a certain percentage of the fair market value that is determined by local assessors to be the total taxable value of land and additions on the property. | Land | Improvement |
|---|---|---|---|---|
| 2024 | $2,487 | $58,000 | $2,400 | $55,600 |
| 2023 | $1,866 | $55,000 | $2,400 | $52,600 |
| 2022 | $594 | $50,000 | $2,400 | $47,600 |
| 2021 | $486 | $28,200 | $2,300 | $25,900 |
| 2020 | $390 | $28,200 | $2,300 | $25,900 |
| 2019 | $244 | $28,200 | $2,300 | $25,900 |
| 2018 | $70 | $28,200 | $2,300 | $25,900 |
| 2017 | $45 | $28,200 | $2,300 | $25,900 |
| 2016 | $28 | $28,200 | $2,300 | $25,900 |
| 2015 | -- | $28,200 | $2,300 | $25,900 |
| 2014 | -- | $28,200 | $2,300 | $25,900 |
Source: Public Records
Map
Nearby Homes
Your Personal Tour Guide
Ask me questions while you tour the home.