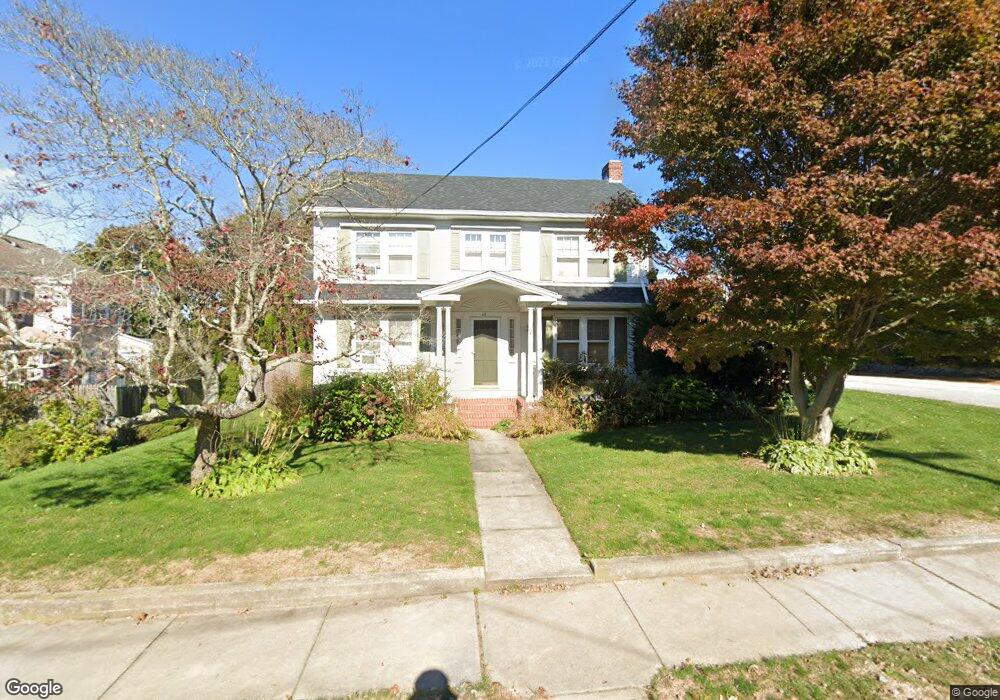
48 John St Westerly, RI 02891
Estimated Value: $456,000 - $549,838
3
Beds
3
Baths
1,945
Sq Ft
$257/Sq Ft
Est. Value
About This Home
This home is located at 48 John St, Westerly, RI 02891 and is currently estimated at $500,460, approximately $257 per square foot. 48 John St is a home located in Washington County with nearby schools including Westerly High School and St. Michael School.
Ownership History
Date
Name
Owned For
Owner Type
Purchase Details
Closed on
Nov 7, 2025
Sold by
Wildmoon Properties Llc
Bought by
Cillino John R
Current Estimated Value
Home Financials for this Owner
Home Financials are based on the most recent Mortgage that was taken out on this home.
Original Mortgage
$395,000
Outstanding Balance
$394,256
Interest Rate
6.3%
Mortgage Type
New Conventional
Estimated Equity
$106,204
Purchase Details
Closed on
Jan 21, 2016
Sold by
Ferraro Lisa M
Bought by
Cellini Enterprises Ll
Purchase Details
Closed on
Nov 15, 2012
Sold by
Ferraro Lisa M and Ferraro Matthew C
Bought by
Ferraro Lisa M
Home Financials for this Owner
Home Financials are based on the most recent Mortgage that was taken out on this home.
Original Mortgage
$165,000
Interest Rate
2.71%
Mortgage Type
New Conventional
Purchase Details
Closed on
Aug 18, 1999
Sold by
Leddy Franklin F and Leddy Marion H
Bought by
Ferraro Mathew C and Ferraro Lisa M
Purchase Details
Closed on
Jun 8, 1990
Sold by
Falcone Angelo J
Bought by
Leddy Franklin F
Create a Home Valuation Report for This Property
The Home Valuation Report is an in-depth analysis detailing your home's value as well as a comparison with similar homes in the area
Home Values in the Area
Average Home Value in this Area
Purchase History
| Date | Buyer | Sale Price | Title Company |
|---|---|---|---|
| Cillino John R | $465,000 | -- | |
| Cellini Enterprises Ll | -- | -- | |
| Ferraro Lisa M | $94,000 | -- | |
| Ferraro Mathew C | $164,000 | -- | |
| Leddy Franklin F | $155,000 | -- |
Source: Public Records
Mortgage History
| Date | Status | Borrower | Loan Amount |
|---|---|---|---|
| Open | Cillino John R | $395,000 | |
| Previous Owner | Leddy Franklin F | $165,000 | |
| Previous Owner | Leddy Franklin F | $45,000 | |
| Previous Owner | Leddy Franklin F | $115,500 |
Source: Public Records
Tax History
| Year | Tax Paid | Tax Assessment Tax Assessment Total Assessment is a certain percentage of the fair market value that is determined by local assessors to be the total taxable value of land and additions on the property. | Land | Improvement |
|---|---|---|---|---|
| 2025 | $3,707 | $476,500 | $190,400 | $286,100 |
| 2024 | $3,755 | $359,300 | $147,000 | $212,300 |
| 2023 | $3,650 | $359,300 | $147,000 | $212,300 |
| 2022 | $3,629 | $359,300 | $147,000 | $212,300 |
| 2021 | $3,714 | $308,000 | $132,900 | $175,100 |
| 2020 | $3,650 | $308,000 | $132,900 | $175,100 |
| 2019 | $3,616 | $308,000 | $132,900 | $175,100 |
| 2018 | $3,499 | $283,300 | $132,900 | $150,400 |
| 2017 | $3,400 | $283,300 | $132,900 | $150,400 |
| 2016 | $3,400 | $283,300 | $132,900 | $150,400 |
| 2015 | $3,309 | $294,700 | $134,800 | $159,900 |
| 2014 | $3,256 | $294,700 | $134,800 | $159,900 |
Source: Public Records
Map
Nearby Homes
- 14 George St
- 16 Spring St
- 25 School St Unit 2
- 21 North Dr
- 38 Prospect St Unit B
- 19 Crestview Dr Unit C
- 23 Abbey Ln Unit 12
- 52 Bellevue Ave
- 24 Abbey Ln Unit 13
- 13 Moss St
- 7 Dixon St
- 33 Whipple Ave
- 141 W Broad St
- 12 Apache Dr Unit A
- 17 West St Unit 3
- 17 Apache Dr Unit G
- 19 Apache Dr Unit F
- 19 Apache Dr Unit 19C
- 0 Iroquois Ave
- 2 Marichris Dr
Your Personal Tour Guide
Ask me questions while you tour the home.