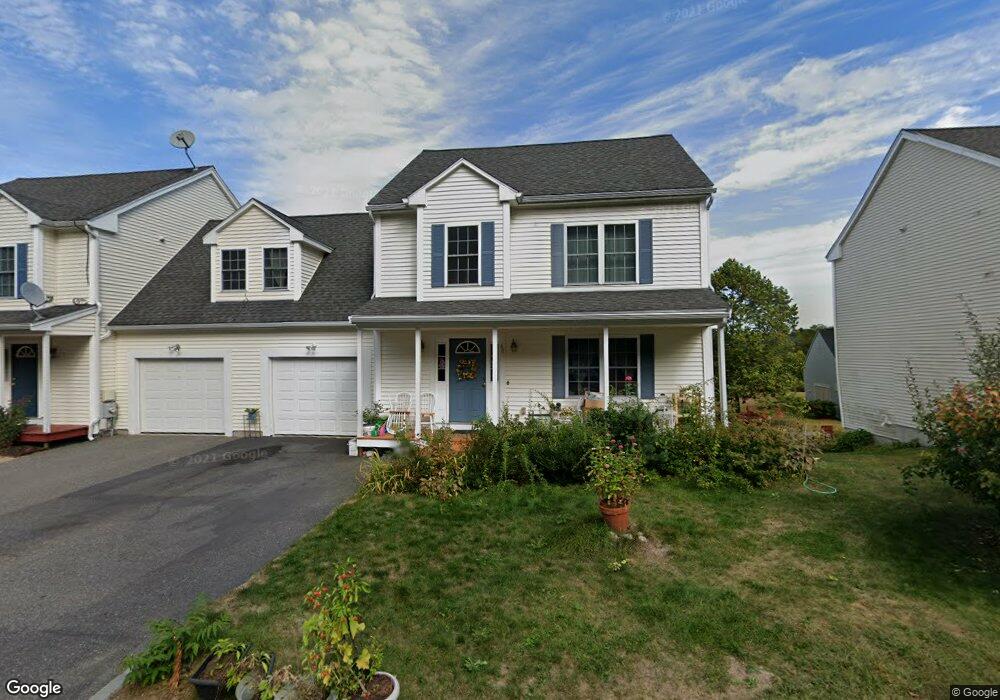
48 Joyce Ln Boxborough, MA 01719
Estimated Value: $692,000 - $783,000
3
Beds
3
Baths
1,584
Sq Ft
$466/Sq Ft
Est. Value
About This Home
This home is located at 48 Joyce Ln, Boxborough, MA 01719 and is currently estimated at $738,751, approximately $466 per square foot. 48 Joyce Ln is a home located in Middlesex County with nearby schools including Acton-Boxborough Regional High School.
Ownership History
Date
Name
Owned For
Owner Type
Purchase Details
Closed on
Aug 20, 2003
Sold by
Boxborough Meadows Llc
Bought by
Lai Wing Kuen and Bi Xiao Min
Current Estimated Value
Home Financials for this Owner
Home Financials are based on the most recent Mortgage that was taken out on this home.
Original Mortgage
$303,000
Interest Rate
5.52%
Mortgage Type
Purchase Money Mortgage
Create a Home Valuation Report for This Property
The Home Valuation Report is an in-depth analysis detailing your home's value as well as a comparison with similar homes in the area
Home Values in the Area
Average Home Value in this Area
Purchase History
| Date | Buyer | Sale Price | Title Company |
|---|---|---|---|
| Lai Wing Kuen | $379,900 | -- | |
| Lai Wing Kuen | $379,900 | -- |
Source: Public Records
Mortgage History
| Date | Status | Borrower | Loan Amount |
|---|---|---|---|
| Open | Lai Wing Kuen | $232,000 | |
| Closed | Lai Wing Kuen | $233,000 | |
| Closed | Lai Wing Kuen | $234,000 | |
| Closed | Lai Wing Kuen | $303,000 |
Source: Public Records
Tax History Compared to Growth
Tax History
| Year | Tax Paid | Tax Assessment Tax Assessment Total Assessment is a certain percentage of the fair market value that is determined by local assessors to be the total taxable value of land and additions on the property. | Land | Improvement |
|---|---|---|---|---|
| 2025 | $9,219 | $608,900 | $174,600 | $434,300 |
| 2024 | $8,411 | $561,100 | $158,500 | $402,600 |
| 2023 | $8,098 | $521,800 | $146,100 | $375,700 |
| 2022 | $7,541 | $432,900 | $146,100 | $286,800 |
| 2020 | $6,797 | $406,500 | $146,100 | $260,400 |
| 2019 | $6,675 | $406,500 | $146,100 | $260,400 |
| 2018 | $7,752 | $390,300 | $156,100 | $234,200 |
| 2017 | $6,890 | $409,900 | $156,100 | $253,800 |
| 2016 | $5,453 | $333,300 | $156,100 | $177,200 |
| 2015 | $6,319 | $379,500 | $166,800 | $212,700 |
| 2014 | $6,469 | $365,700 | $165,100 | $200,600 |
Source: Public Records
Map
Nearby Homes
- 96 Cedarwood Rd
- 777 Depot Rd
- 134 Russet Ln
- 68 Macintosh Ln
- 1155 Burroughs Rd
- 139 Picnic St
- 12 Olde Lantern Rd
- 62 Waite Rd
- 5 Elm St Unit 1
- 207 Boxboro Rd
- 9 Elm St Unit 1
- 92 Willow St Unit 3
- 92 Willow St Unit 2
- 90 Willow St Unit 1
- 58 Spencer Rd Unit 18K
- 285 Central St Unit 285
- 53 Swanson Ct Unit 36C
- 50 Spencer Rd Unit 36
- 42 Swanson Ct Unit 14A
- 3 Heather Hill Rd