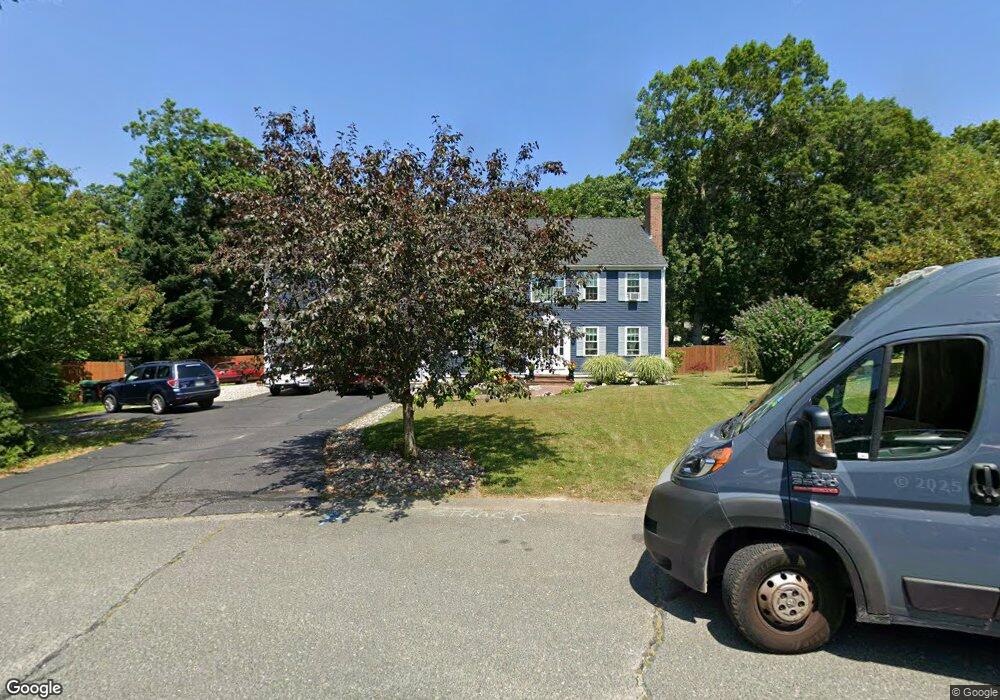
48 Kenelm Dr Marshfield, MA 02050
Ocean Bluff-Brant Rock NeighborhoodEstimated Value: $847,000 - $1,027,000
5
Beds
4
Baths
2,720
Sq Ft
$344/Sq Ft
Est. Value
About This Home
This home is located at 48 Kenelm Dr, Marshfield, MA 02050 and is currently estimated at $935,507, approximately $343 per square foot. 48 Kenelm Dr is a home located in Plymouth County with nearby schools including Daniel Webster, Furnace Brook Middle School, and Marshfield High School.
Ownership History
Date
Name
Owned For
Owner Type
Purchase Details
Closed on
Feb 24, 2015
Sold by
Gilmore Charles P and Gilmore Elizabeth A
Bought by
Gilmore Elizabeth A
Current Estimated Value
Purchase Details
Closed on
Feb 21, 1997
Sold by
Fiddler Inc
Bought by
Gilmore Charles P and Gilmore Elizabeth A
Home Financials for this Owner
Home Financials are based on the most recent Mortgage that was taken out on this home.
Original Mortgage
$202,500
Interest Rate
7.8%
Mortgage Type
Purchase Money Mortgage
Create a Home Valuation Report for This Property
The Home Valuation Report is an in-depth analysis detailing your home's value as well as a comparison with similar homes in the area
Home Values in the Area
Average Home Value in this Area
Purchase History
| Date | Buyer | Sale Price | Title Company |
|---|---|---|---|
| Gilmore Elizabeth A | -- | -- | |
| Gilmore Elizabeth A | -- | -- | |
| Gilmore Charles P | $225,000 | -- |
Source: Public Records
Mortgage History
| Date | Status | Borrower | Loan Amount |
|---|---|---|---|
| Previous Owner | Gilmore Charles P | $48,000 | |
| Previous Owner | Gilmore Charles P | $208,000 | |
| Previous Owner | Gilmore Charles P | $202,500 |
Source: Public Records
Tax History Compared to Growth
Tax History
| Year | Tax Paid | Tax Assessment Tax Assessment Total Assessment is a certain percentage of the fair market value that is determined by local assessors to be the total taxable value of land and additions on the property. | Land | Improvement |
|---|---|---|---|---|
| 2025 | $8,443 | $852,800 | $304,200 | $548,600 |
| 2024 | $7,491 | $721,000 | $289,700 | $431,300 |
| 2023 | $7,045 | $635,800 | $258,700 | $377,100 |
| 2022 | $7,045 | $544,000 | $217,300 | $326,700 |
| 2021 | $6,774 | $513,600 | $217,300 | $296,300 |
| 2020 | $6,349 | $476,300 | $196,600 | $279,700 |
| 2019 | $6,176 | $461,600 | $196,600 | $265,000 |
| 2018 | $6,107 | $456,800 | $196,600 | $260,200 |
| 2017 | $6,045 | $440,600 | $196,600 | $244,000 |
| 2016 | $5,909 | $425,700 | $196,600 | $229,100 |
| 2015 | $5,591 | $420,700 | $196,600 | $224,100 |
| 2014 | $5,523 | $415,600 | $196,600 | $219,000 |
Source: Public Records
Map
Nearby Homes
- 37 Homestead Ave
- 11 Leon St
- 81 Constellation Rd
- 809 Ocean St
- 32 Gratto Rd
- 55 Abbey St
- 30 Chandler Dr
- 8 Duxbury St
- 24 Second (2nd) Rd
- 19 2nd Rd
- 92 Salt Meadow Waye
- 39 High Beacon Way
- 95 Telegraph Hill Rd
- K10-07-05 Alden St
- 255 Ridge Rd
- 29 Oxen Dr
- 311 S River St
- 78 Tower Ave
- 90 Presidential Cir
- 566 Holly Rd