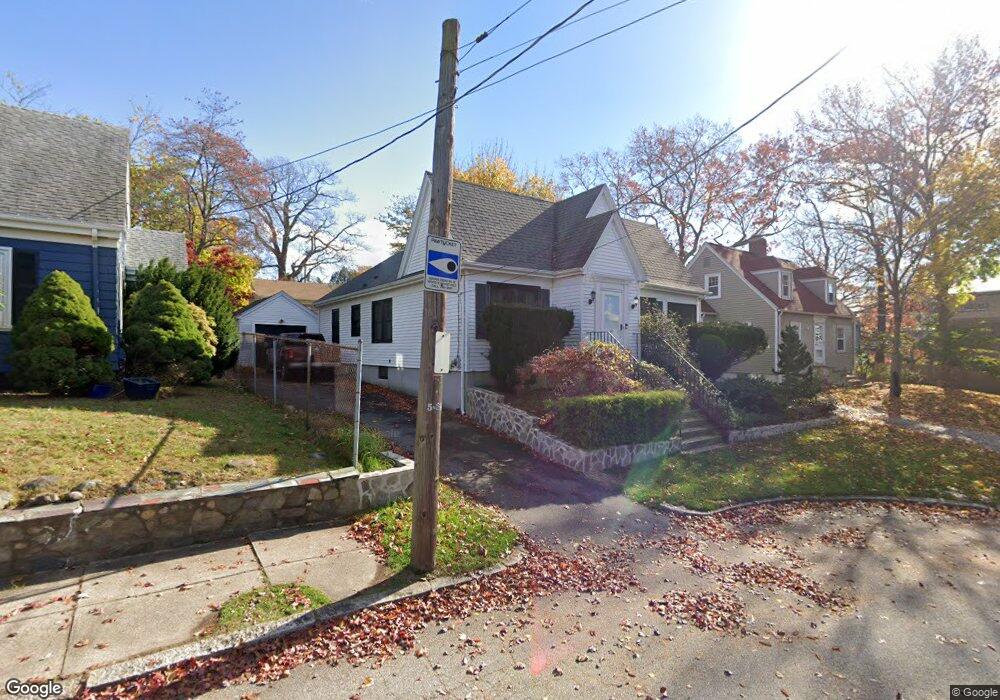
48 Kimball Ave Pawtucket, RI 02860
Oak Hill NeighborhoodEstimated Value: $461,000 - $634,000
3
Beds
2
Baths
1,298
Sq Ft
$412/Sq Ft
Est. Value
About This Home
This home is located at 48 Kimball Ave, Pawtucket, RI 02860 and is currently estimated at $534,497, approximately $411 per square foot. 48 Kimball Ave is a home located in Providence County with nearby schools including International Charter School, Blackstone Academy Charter School, and Ocean Tides School.
Ownership History
Date
Name
Owned For
Owner Type
Purchase Details
Closed on
Nov 16, 1998
Sold by
Quinn Susan L and Caldarone Alberta R
Bought by
Amesbury Mark P and Amesbury Elizabeth
Current Estimated Value
Home Financials for this Owner
Home Financials are based on the most recent Mortgage that was taken out on this home.
Original Mortgage
$89,928
Outstanding Balance
$19,265
Interest Rate
6.65%
Estimated Equity
$515,232
Purchase Details
Closed on
Dec 18, 1989
Sold by
Mcburney Christine
Bought by
Carden Susan L
Home Financials for this Owner
Home Financials are based on the most recent Mortgage that was taken out on this home.
Original Mortgage
$90,400
Interest Rate
9.73%
Create a Home Valuation Report for This Property
The Home Valuation Report is an in-depth analysis detailing your home's value as well as a comparison with similar homes in the area
Home Values in the Area
Average Home Value in this Area
Purchase History
| Date | Buyer | Sale Price | Title Company |
|---|---|---|---|
| Amesbury Mark P | $90,000 | -- | |
| Carden Susan L | $113,000 | -- |
Source: Public Records
Mortgage History
| Date | Status | Borrower | Loan Amount |
|---|---|---|---|
| Open | Carden Susan L | $89,928 | |
| Previous Owner | Carden Susan L | $90,400 |
Source: Public Records
Tax History Compared to Growth
Tax History
| Year | Tax Paid | Tax Assessment Tax Assessment Total Assessment is a certain percentage of the fair market value that is determined by local assessors to be the total taxable value of land and additions on the property. | Land | Improvement |
|---|---|---|---|---|
| 2025 | $4,685 | $356,300 | $163,200 | $193,100 |
| 2024 | $4,397 | $356,300 | $163,200 | $193,100 |
| 2023 | $4,069 | $240,200 | $97,400 | $142,800 |
| 2022 | $3,983 | $240,200 | $97,400 | $142,800 |
| 2021 | $3,983 | $240,200 | $97,400 | $142,800 |
| 2020 | $4,324 | $207,000 | $110,800 | $96,200 |
| 2019 | $4,324 | $207,000 | $110,800 | $96,200 |
| 2018 | $4,167 | $207,000 | $110,800 | $96,200 |
| 2017 | $3,678 | $161,900 | $87,200 | $74,700 |
| 2016 | $3,544 | $161,900 | $87,200 | $74,700 |
| 2015 | $3,544 | $161,900 | $87,200 | $74,700 |
| 2014 | $3,507 | $152,100 | $87,200 | $64,900 |
Source: Public Records
Map
Nearby Homes