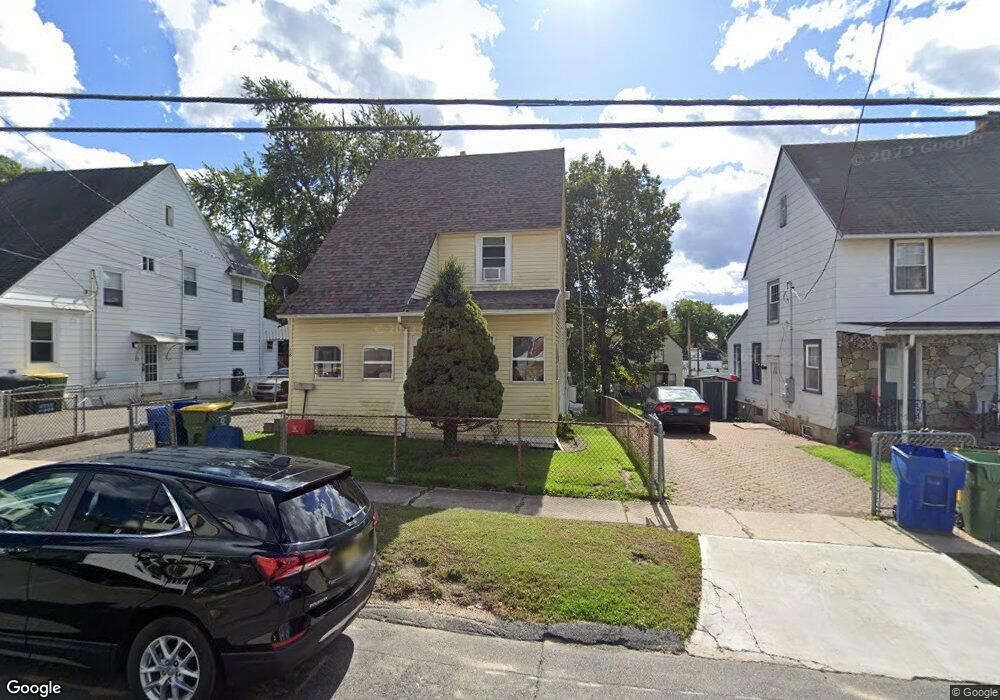
48 Laval St Waterbury, CT 06706
South End District NeighborhoodEstimated Value: $165,000 - $284,432
3
Beds
2
Baths
1,584
Sq Ft
$144/Sq Ft
Est. Value
About This Home
This home is located at 48 Laval St, Waterbury, CT 06706 and is currently estimated at $228,608, approximately $144 per square foot. 48 Laval St is a home located in New Haven County with nearby schools including Washington School, West Side Middle School, and Crosby High School.
Ownership History
Date
Name
Owned For
Owner Type
Purchase Details
Closed on
Jun 10, 2005
Sold by
Palomba Carlo
Bought by
Garcia Andres and Garcia Carmen
Current Estimated Value
Purchase Details
Closed on
Mar 22, 1999
Sold by
Bank Of America
Bought by
Graham Robert and Graham Patricia
Create a Home Valuation Report for This Property
The Home Valuation Report is an in-depth analysis detailing your home's value as well as a comparison with similar homes in the area
Home Values in the Area
Average Home Value in this Area
Purchase History
| Date | Buyer | Sale Price | Title Company |
|---|---|---|---|
| Garcia Andres | $114,900 | -- | |
| Graham Robert | $25,000 | -- |
Source: Public Records
Mortgage History
| Date | Status | Borrower | Loan Amount |
|---|---|---|---|
| Open | Graham Robert | $128,800 | |
| Closed | Graham Robert | $16,038 | |
| Closed | Graham Robert | $128,000 |
Source: Public Records
Tax History Compared to Growth
Tax History
| Year | Tax Paid | Tax Assessment Tax Assessment Total Assessment is a certain percentage of the fair market value that is determined by local assessors to be the total taxable value of land and additions on the property. | Land | Improvement |
|---|---|---|---|---|
| 2025 | $4,547 | $101,080 | $13,860 | $87,220 |
| 2024 | $4,997 | $101,080 | $13,860 | $87,220 |
| 2023 | $5,478 | $101,080 | $13,860 | $87,220 |
| 2022 | $3,676 | $61,060 | $13,860 | $47,200 |
| 2021 | $3,676 | $61,060 | $13,860 | $47,200 |
| 2020 | $3,676 | $61,060 | $13,860 | $47,200 |
| 2019 | $3,676 | $61,060 | $13,860 | $47,200 |
| 2018 | $3,676 | $61,060 | $13,860 | $47,200 |
| 2017 | $3,791 | $62,970 | $13,860 | $49,110 |
| 2016 | $3,791 | $62,970 | $13,860 | $49,110 |
| 2015 | $3,666 | $62,970 | $13,860 | $49,110 |
| 2014 | $3,666 | $62,970 | $13,860 | $49,110 |
Source: Public Records
Map
Nearby Homes