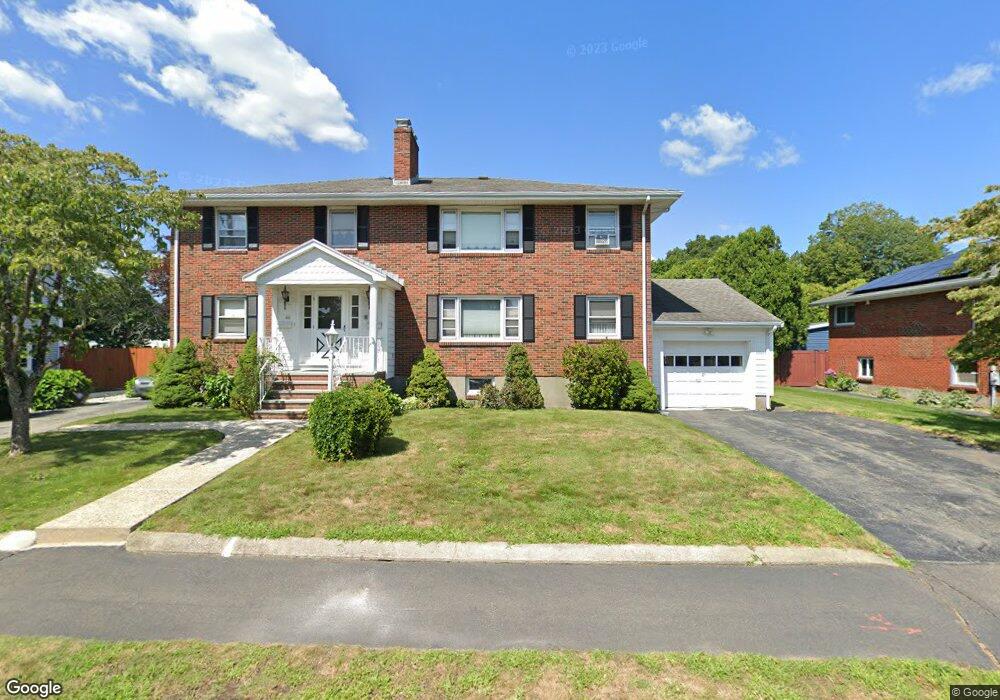
48 Lee St Unit 50 Stoneham, MA 02180
Lindenwood NeighborhoodEstimated Value: $975,000 - $1,272,000
4
Beds
4
Baths
4,223
Sq Ft
$280/Sq Ft
Est. Value
About This Home
This home is located at 48 Lee St Unit 50, Stoneham, MA 02180 and is currently estimated at $1,183,023, approximately $280 per square foot. 48 Lee St Unit 50 is a home located in Middlesex County with nearby schools including Stoneham High School and St. Patrick Elementary School.
Ownership History
Date
Name
Owned For
Owner Type
Purchase Details
Closed on
Jul 10, 2025
Sold by
Gargano Maria Est and Riley
Bought by
Shahi Sunil and Sherpa Pasang L
Current Estimated Value
Home Financials for this Owner
Home Financials are based on the most recent Mortgage that was taken out on this home.
Original Mortgage
$1,032,650
Outstanding Balance
$1,026,490
Interest Rate
6.89%
Mortgage Type
New Conventional
Estimated Equity
$156,533
Create a Home Valuation Report for This Property
The Home Valuation Report is an in-depth analysis detailing your home's value as well as a comparison with similar homes in the area
Home Values in the Area
Average Home Value in this Area
Purchase History
| Date | Buyer | Sale Price | Title Company |
|---|---|---|---|
| Shahi Sunil | $1,250,000 | -- | |
| Shahi Sunil | $1,250,000 | -- |
Source: Public Records
Mortgage History
| Date | Status | Borrower | Loan Amount |
|---|---|---|---|
| Open | Shahi Sunil | $1,032,650 | |
| Closed | Shahi Sunil | $1,032,650 |
Source: Public Records
Tax History
| Year | Tax Paid | Tax Assessment Tax Assessment Total Assessment is a certain percentage of the fair market value that is determined by local assessors to be the total taxable value of land and additions on the property. | Land | Improvement |
|---|---|---|---|---|
| 2025 | $9,993 | $976,800 | $400,100 | $576,700 |
| 2024 | $10,101 | $953,800 | $370,100 | $583,700 |
| 2023 | $10,254 | $923,800 | $340,100 | $583,700 |
| 2022 | $9,276 | $891,100 | $320,100 | $571,000 |
| 2021 | $9,170 | $847,500 | $300,100 | $547,400 |
| 2020 | $8,833 | $818,600 | $300,100 | $518,500 |
| 2019 | $8,073 | $719,500 | $270,100 | $449,400 |
| 2018 | $8,135 | $694,700 | $250,100 | $444,600 |
| 2017 | $7,574 | $611,300 | $240,100 | $371,200 |
| 2016 | $7,525 | $592,500 | $240,100 | $352,400 |
| 2015 | $7,558 | $583,200 | $240,100 | $343,100 |
| 2014 | $7,290 | $540,400 | $220,100 | $320,300 |
Source: Public Records
Map
Nearby Homes
- 1 Alden Ave
- 159 Main St Unit 27C
- 159 Main St Unit 39A
- 98 Main St Unit 2
- 68 Main St Unit 21C
- 66 Main St Unit 15A
- 8 Steele St
- 12 Isola Ln
- 64 Main St Unit 24B
- 200 Ledgewood Dr Unit 601
- 75 Augustus Ct Unit 2003
- 1 Tremont St
- 246 Walnut St
- 62 High St Unit Lot 8
- 62 High St Unit 4
- 62 High St Unit Lot 5
- 62 High St Unit Lot 12
- 313 South St
- 21 Tremont St Unit B
- 21 Tremont St Unit A
Your Personal Tour Guide
Ask me questions while you tour the home.